# Introduction

### Welcome to the FinnGen Handbook!

The following documentation contains both useful **background information, specifics of the FinnGen data**, and **clear instructions** that are meant to help you get the most out of FinnGen data.

### How to use FinnGen Handbook

FinnGen Handbook has quickly grown to be an extensive source of information, and it may be sometimes challenging to find the specific information that you are looking for.

The easiest way to navigate in the FinnGen Handbook is to use the **search** bar in the top-right corner of the page. You can use any type of search terms, for example, the name of a specific data file or a certain analysis type.

If searching doesn't answer your questions, we recommend trying out [GitBook Lens](https://www.gitbook.com/solutions/ai). It's an AI made by GitBook that analyses the handbook based on your questions and attempts to answer them accordingly. **The answers that Lens provides may, at times, be inaccurate, so it should be used with caution.** It is recommended to try and only ask relatively simple questions. Lens can be found in the search bar.

You can also browse pages by opening the main pages on the **left-side menu**. The main pages contain several sub-pages as you dive deeper into the FinnGen Handbook.

<figure><img src="https://3072695768-files.gitbook.io/~/files/v0/b/gitbook-x-prod.appspot.com/o/spaces%2F-MhYL0UTLjqsuIdK0SSO%2Fuploads%2Fgit-blob-c2d24dfe8b7243806217ee3b8138831cfdf114c1%2FN%C3%A4ytt%C3%B6kuva%202023-2-10%20kello%2013.53.15.png?alt=media" alt=""><figcaption><p>Welcome to the FinnGen Handbook! ❤️</p></figcaption></figure>

### FinnGen Handbook is meant for everyone

After a one year embargo, the FinnGen research project regularly publishes data releases containing summary statistics and Genome Wide Association Study results, which can be freely used. Additionally, researchers in organizations that have partnered with the FinnGen study can request access to either the newest aggregate results or, when wishing to do their own analyses, access to the FinnGen Sandbox environment.

If you are using publicly available FinnGen data or readily available results published by the FinnGen analysis team, you will find [**Background concepts**](/background-reading)**,** [**FinnGen data specifics**](/finngen-data-specifics)**,** or [**Working outside of the Sandbox**](/working-outside-the-sandbox) useful. If you are a FinnGen partner organization affiliate and are or will be working on your own analysis inside the FinnGen [Sandbox](https://sandbox.finngen.fi/), you might also be interested in reading further into the section [**Working in the Sandbox**](/working-in-the-sandbox).

The first version of the handbook was compiled during the spring/summer of 2021. For the most part, we will describe the key structural points of the development of FinnGen and how you could use the data.


# Where to begin

FinnGen Handbook has turned out to be an extensive source of information!

The **"Where to Begin"** section offers an overview of the FinnGen project and helps you get started. It includes **quick guides** and **question-oriented** starting points. Each section contains links to other Handbook pages that provide more detailed explanations.

#### Where to begin section guides you through your first steps in FinnGen!

![Get familiarized with FinnGen Handbook and run your first GWAS analysis!](https://3072695768-files.gitbook.io/~/files/v0/b/gitbook-x-prod.appspot.com/o/spaces%2F-MhYL0UTLjqsuIdK0SSO%2Fuploads%2Fgit-blob-5003f93b40fdf838f35f18d64f4c167a7f661cd1%2Fkuva%20\(41\).png?alt=media)


# Quick guides

These quick guides helps new FinnGen users orient, with general information followed by specific guides for green and red data access types:

{% content-ref url="/pages/bcF65pExroOmzGm8dOvj" %}
[New to FinnGen](/where-to-begin.../quick-guides/new-to-finngen)
{% endcontent-ref %}

{% content-ref url="/pages/8u0qjmw6AnvOt0unyQ43" %}
[Green data users](/where-to-begin.../quick-guides/green-data-users)
{% endcontent-ref %}

{% content-ref url="/pages/aOEGR2f01r4PfpdA4FRt" %}
[Red data users](/where-to-begin.../quick-guides/red-data-users)
{% endcontent-ref %}

\ <br>


# New to FinnGen

### What is FinnGen?

FinnGen is a public-private collaborative research project initiated in 2017. The study combines genomics, omics and health data from 520,210 individuals to understand human diseases and traits. In FinnGen all research must follow the[ FinnGen Scientific Plan](https://www.finngen.fi/en/members/document/218) and its amendments ([FinnGen 2 Scientific Plan](https://www.finngen.fi/en/members/document/217) and[ FinnGen 3 Scientific Plan](https://www.finngen.fi/en/members/document/1354)). Data use is limited to research outlined in the plan, with analyses requiring a clear scientific purpose and potential for publishable results. To read more about FinnGen, please see the [FinnGen website](https://www.finngen.fi/en) and the [FinnGen Handbook](https://finngen.gitbook.io/finngen-handbook).

### FinnGen Data

**Genetic data:**

All 520,210 FinnGen study subjects have undergone genome-wide genotyping. About 450,000 were genotyped using [FinnGen ThermoFisher Axiom custom array](https://www.finngen.fi/en/genetic_data), while \~70,000 "[legacy genotypes](/finngen-data-specifics/red-library-data-individual-level-data/genotype-data/affymetrix-chip-and-its-design/legacy-cohorts-and-chips)" originate primarily from the National Institute of Health and Welfare biobank samples genotyped before FinnGen, using various Illumina GWAS arrays.

To enhance utility, all samples were imputed using a [Finnish whole-genome reference](/finngen-data-specifics/red-library-data-individual-level-data/genotype-data/imputation-panel/sisu-v4-reference-panel) (≈8,700 individuals), yielding inferred genomes with \~21 million variants per individual. All genotype data is in human genome build GRCh38/hg38.

Additionally, FinnGen includes "legacy next-generation sequencing (NGS) variant" data from [\~25,000 whole-exome sequenced (WES)](/finngen-data-specifics/red-library-data-individual-level-data/whole-exome-sequencing-wes-data) and \~2,000 whole-genome sequenced (WGS) study subjects, primarily from the THL biobank.

**Health register data:**

[FinnGen’s health register data](/finngen-data-specifics/red-library-data-individual-level-data/what-phenotype-files-are-available-in-sandbox-1/registers-in-the-detailed-longitudinal-data) comprises detailed, harmonized longitudinal records from multiple Finnish registries, capturing health events, drug purchases, and hospitalizations for all participants. Majority of the health register data is available from all 520,210 individuals. [Supplementary registries](/finngen-data-specifics/red-library-data-individual-level-data/what-phenotype-files-are-available-in-sandbox-1/other-registers) provide additional information. [The Kanta Lab data](/finngen-data-specifics/red-library-data-individual-level-data/what-phenotype-files-are-available-in-sandbox-1/kanta-lab-values), obtained from Finland’s national Kanta register, includes lab test results from public and private healthcare providers.

**Other phenotype and biological data:**

The bulk of the data in FinnGen consists of the genotypes and the health register data which is available from all FinnGen study subjects. However, during the project timeline the study is expanding to generate other data types of subset of its participants including [additional phenotype data](https://www.finngen.fi/en/node/2001) related to study subjects with particular diseases and [other biological data](https://www.finngen.fi/en/node/1997), such as [proteomics](/finngen-data-specifics/red-library-data-individual-level-data/omics-data/proteomics), [metabolomics](/finngen-data-specifics/red-library-data-individual-level-data/omics-data/metabolomics) and [single-nuclei RNA & ATAC sequencing](/finngen-data-specifics/red-library-data-individual-level-data/omics-data/single-cell-transcriptomics-and-immune-profiling) data.

FinnGen data is categorized into so-called “[<mark style="color:red;background-color:red;">**red**</mark>” and “<mark style="color:green;background-color:green;">**green**</mark>](/faq/about-finngen-access-and-accounts/do-i-need-red-or-green-data-access)” data that are accessible to researchers from [FinnGen partner organizations](https://www.finngen.fi/en/partners) who have requested access.

<figure><img src="https://3072695768-files.gitbook.io/~/files/v0/b/gitbook-x-prod.appspot.com/o/spaces%2F-MhYL0UTLjqsuIdK0SSO%2Fuploads%2FLfpfTy9bjaezdKwBUGWQ%2Fimage.png?alt=media&amp;token=3fa6da4b-a181-4c9d-a848-6ecbdf313507" alt=""><figcaption></figcaption></figure>

<mark style="color:red;background-color:red;">**Red data**</mark> is individual-level genotype or phenotype data which is located in the Sandbox cloud computing environment and which researchers can use to run their own analyses if individual-level genotypes and/or phenotypes are required as input. We call this data "<mark style="color:red;background-color:red;">**red**</mark>" to remind users that we always need to take extra care and security in working with this data. Each partner/research group that has a Sandbox must cover their own computing and storage costs. Information on costs can be found under [Billing information and where to find more details](/working-in-the-sandbox/billing-information-and-where-to-find-more-details).

To learn more about the <mark style="color:green;background-color:green;">**green**</mark> and <mark style="color:red;background-color:red;">**red**</mark> data and what you can do with them, please see the [Green data](/where-to-begin.../quick-guides/green-data-users) and [Red data](/where-to-begin.../quick-guides/red-data-users) user’s quick guides.

### Data access

FinnGen has important health and genetic information about people. Keeping this data safe is really important both for trust and GDPR reasons. Everyone at FinnGen has to make sure it stays private and secure!

To get access to the <mark style="color:green;background-color:green;">**green**</mark> or <mark style="color:red;background-color:red;">**red**</mark> FinnGen data, see the [FinnGen access and accounts](/faq/about-finngen-access-and-accounts). Approval to access the <mark style="color:green;background-color:green;">**green data**</mark> takes up to 7 working days and to the <mark style="color:red;background-color:red;">**red**</mark> data from 1 to 2 months. <mark style="color:green;background-color:green;">**Green data**</mark> is accessible by anyone with a @finngen.fi account and the data be downloaded directly to the user's local machine. For <mark style="color:red;background-color:red;">**red**</mark> data access you need access to the Sandbox in addition to having a @finngen.fi account. You are also required to take a data security exam once a year. This is to make sure the data related to the study subjects is not mishandled. Please read more in the FinnGen Handbook, section [Data Protection & Security](/data-protection-and-security).

<figure><img src="https://3072695768-files.gitbook.io/~/files/v0/b/gitbook-x-prod.appspot.com/o/spaces%2F-MhYL0UTLjqsuIdK0SSO%2Fuploads%2FE0DPqH20n663GJYjtrzW%2FAccess%20process.png?alt=media&amp;token=3fa5a392-c1b0-498f-9c90-7330a317296f" alt=""><figcaption><p>Green and red data access process</p></figcaption></figure>

Downloading results from Sandbox and proceeding to publication requires submitting an [analysis proposal](/finngen-data-specifics/about-analysis-proposals). This ensures that on-going studies do not overlap and follow the FinnGen Scientific Plan. See also the requirements for [citing FinnGen](/faq/about-public-releases) in your manuscript.

FinnGen has Task Forces and Interest groups that concentrate on studying the progression of [selected phenotypes](https://www.finngen.fi/en/node/1977). All FinnGen Partner researchers are welcome to join the Task Forces or the Interest Groups. If you would like to join one of them please email <finngen-servicedesk@helsinki.fi>.

### Where to get help?

Besides the extensive descriptions in the [FinnGen Handbook](https://finngen.gitbook.io/finngen-handbook), all new users are automatically joined to the **FinnGen Slack workspace**, where there are multiple channels where the FinnGen community can help each other.

**FinnGen Science & Users' meetings** are held once a month (usually the third week of the month) on Tuesdays at 9:05 AM - 10:30 AM (EST) / 4:05 PM - 5:30 PM (HEL) via Zoom.

**The FinnGen office hours (Q\&A)** are held on Zoom the day after the monthly FinnGen Science & Users' meeting. The European session is from 1-2 PM Helsinki time, and the US session is at 1–2 PM Boston time.

Finnish academics can also contact their [**Local SupPers**](https://www.finngen.fi/en/node/1974)**, i.e. support persons:** Jaakko Tyrmi (University of Oulu; <jaakko.tyrmi@oulu.fi>), Tero Sievänen (University of Eastern Finland; <tero.sievanen@uef.fi>), Timo Pohjonen (University of Jyväskylä; <timo.pohjonen@hyvaks.fi>), Vidal Fey (University of Tampere; <vidal.fey@tuni.fi>), and Rui Jian Chu (University of Turku; <finngen-support@utu.fi> tai <ruijian.chu@utu.fi>).

If you would like to receive calendar invitations for the above-mentioned meetings or if you have any questions regarding FinnGen, please email <finngen-servicedesk@helsinki.fi>.


# Green data users

### What is <mark style="color:green;background-color:green;">green data</mark>?

In FinnGen, [<mark style="color:green;background-color:green;">**green data**</mark>](#what-is-green-data) refers to aggregated, anonymous summary-level data from which no individual can be identified. By <mark style="color:green;background-color:green;">**green data**</mark> we most commonly mean aggregate level result data, but also other data that are not individual-level participant data (that is <mark style="color:red;background-color:red;">**red data**</mark>) can be considered <mark style="color:green;background-color:green;">**green data**</mark>.

**Examples of&#x20;**<mark style="color:green;background-color:green;">**green data**</mark>**&#x20;include:**

* Summary-level results from FinnGen’s core analysis team, shared with Consortium Partner researchers.
* Summary-level results/data generated within the FinnGen Sandbox.
* Publicly available summary-level results/data from FinnGen.
* Any other data or results without personal-level FinnGen participant information.

### How to access <mark style="color:green;background-color:green;">green data</mark>?

To get access to the <mark style="color:green;background-color:green;">**green**</mark> FinnGen data, see the [FinnGen access and accounts](/faq/about-finngen-access-and-accounts). Only FinnGen partner [organization](https://www.finngen.fi/en/partners) affiliates can get access to the <mark style="color:green;background-color:green;">**green data**</mark>. Approval to access takes up to 7 working days. <mark style="color:green;background-color:green;">**Green data**</mark> is accessible by anyone with a @finngen.fi account and the data be downloaded directly to the user's local machine.

Green data that are publicly accessible (not anymore in [embargo](/publishing-finngen-results/genemal-policy-of-1-yr-exclusivity-period)) can be accessed without credentials. More information on how to access public FinnGen results is found [here](https://www.finngen.fi/en/access_results).

### Using green data

Users with credentials (<my.name@finngen.fi>) can download FinnGen core analysis team produced <mark style="color:green;background-color:green;">**green data**</mark> from FinnGen so called "green library" [here](https://console.cloud.google.com/storage/browser/finngen-production-library-green). Data usage must comply with [FinnGen’s 1-year exclusivity policy](/publishing-finngen-results/genemal-policy-of-1-yr-exclusivity-period). Publishing [embargoed data ](/publishing-finngen-results/genemal-policy-of-1-yr-exclusivity-period)requires approval from the FinnGen Scientific Committee (that is an [approved analysis proposa](/finngen-data-specifics/about-analysis-proposals)[l](/finngen-data-specifics/about-analysis-proposals)). If the user works with <mark style="color:green;background-color:green;">**green data**</mark> which has passed the embargo and is publicly available, they don’t need to have an analysis proposal.

### <mark style="color:green;background-color:green;">Green data</mark> tools

There are various ways to explore and browse <mark style="color:green;background-color:green;">**green data**</mark>. The full [catalog of FinnGen tools](/tool-catalog), including the <mark style="color:green;background-color:green;">**green data**</mark> tools, is available [here](https://finngen.gitbook.io/finngen-handbook/tool-catalog). For example, the user might be interested in comparing their GWAS result to FinnGen core analysis results, or explore disease codes or lab measurements enriched in a certain endpoint.

### How to download green data?

The <mark style="color:green;background-color:green;">**green data**</mark> generated by the FinnGen core analysis teams are stored in the “[green library](/working-outside-the-sandbox/green-library-data)” which exists as a Google Cloud storage bucket named “[finngen-production-library-green](/working-outside-the-sandbox/green-library-data)”. [To download this data](#how-to-download-green-data), the user needs to have FinnGen credentials and <mark style="color:green;background-color:green;">**green data**</mark> access. The detailed instructions on how to download <mark style="color:green;background-color:green;">**green data**</mark> is available [here](https://finngen.gitbook.io/finngen-handbook/finngen-data-specifics/green-library-data-aggregate-data/how-can-you-download-green-data). Users without FinnGen credentials can download publicly available green library data using an online [form](https://elomake.helsinki.fi/lomakkeet/124935/lomake.html).

Sandbox users can also generate “<mark style="color:green;background-color:green;">**green data**</mark>” as a result of analysis they have conducted on the individual level data (<mark style="color:red;background-color:red;">**red data**</mark>) in the Sandbox. Only <mark style="color:green;background-color:green;">**green data**</mark> can be downloaded out from the Sandbox. The detailed instructions on how to download results from the user’s Sandbox IVM are [here](/working-in-the-sandbox/quirks-and-features/how-to-download-results-from-your-ivm).

<br>


# Red data users

### What is <mark style="color:red;background-color:red;">red data</mark>?

The FinnGen data is constructed from the Finnish health and laboratory registries combined with the individual genotype information. In FinnGen, we refer to all sensitive individual-level data as "<mark style="color:red;background-color:red;">**red**</mark>" to emphasize the need for extra care and security when handling it. The <mark style="color:red;background-color:red;">**red data**</mark> is accessible within the [Sandbox environment](/faq/about-sandbox), where all the individual-level genotype, phenotype and other omics data can be found. The <mark style="color:red;background-color:red;">**red data**</mark> is pseudo anonymized (or pseudonymized), which means, there is no direct identifying information to the study subjects in the data.

### How to access <mark style="color:red;background-color:red;">red data</mark>?

<mark style="color:red;background-color:red;">**Red data**</mark> is located in the [Sandbox](/faq/about-sandbox) cloud computing environment and which researchers can use to run their own analyses. To get access to the red FinnGen data, see the [FinnGen access and accounts](/faq/about-finngen-access-and-accounts). Only FinnGen partner [organization](https://www.finngen.fi/en/partners) affiliates can get access to the <mark style="color:red;background-color:red;">**red data**</mark> in the Sandox. Approval to access takes 1-2 months.

In FinnGen, <mark style="color:red;background-color:red;">**red data**</mark> is securely protected to prevent unauthorized access, loss, or damage. Access to the Sandbox is granted only after proper paperwork and passing a security exam. Your FinnGen account must have two-factor authentication (2FA) enabled to log in. For questions or concerns about data protection, contact the FinnGen Data Protection Officer at <dpo-finngen@helsinki.fi> or phone: +358 2941 24317 (mobile: +358 50 4793618).

Once granted access to FinnGen <mark style="color:red;background-color:red;">**red data**</mark>, an interactive virtual machine (IVM) will be created for you within your organization's Sandbox. This IVM, accessible via a web browser, is a Unix machine with a graphical interface hosted in the Google Cloud.

### Using <mark style="color:red;background-color:red;">red data</mark>

To conduct research in the [FinnGen Sandbox](/faq/about-sandbox), it is essential to adhere to the [FinnGen Scientific Plan](https://www.finngen.fi/en/members/document/218) and its amendments ([FinnGen 2 Scientific Plan](https://www.finngen.fi/en/members/document/217) and[ FinnGen 3 Scientific Plan](https://www.finngen.fi/en/members/document/1354)). In summary, the main goal of FinnGen is to better understand how health and disease change over time, interpret genetic signals, and develop personalized medicine and new analytical methods. The FinnGen scientific director and scientific committee oversees research using <mark style="color:red;background-color:red;">**red data**</mark> through the [FinnGen analysis proposal](/finngen-data-specifics/about-analysis-proposals). An analysis proposal is not mandatory for operating within the Sandbox, but it is required to download results. Please also familiarize yourself also with FinnGen guidelines regarding [1-year exclusivity period](/publishing-finngen-results/genemal-policy-of-1-yr-exclusivity-period) policy and [citing](/faq/about-public-releases) guidelines.

FinnGen aims to group similar research under a single analysis proposal, granting only one analysis right for similar studies. You can check the active analysis proposals in the FinnGen appsheet, and then apply for the [analysis proposal.](/finngen-data-specifics/about-analysis-proposals)

If you suspect a data breach, report it immediately using[ the online reporting](https://elomake.helsinki.fi/lomakkeet/103627/lomake.html) form available in the members’ area or by [contacting the DPO directly](/data-protection-and-security). Examples of data breaches include unauthorized access to <mark style="color:red;background-color:red;">**red data**</mark>, the <mark style="color:red;background-color:red;">**red data**</mark> outside FinnGen Sandbox, and sharing the <mark style="color:red;background-color:red;">**red data**</mark> in presentations or manuscripts. If you lose your @finngen.fi credentials or suspect they have been compromised, contact <finngen-servicedesk@helsinki.fi> immediately. Also, contact the service desk when you no longer need your account.

By following these guidelines, you can ensure your research is compliant with FinnGen's standards and secure access to necessary resources and support.

### <mark style="color:red;background-color:red;">Red data</mark> tools

The FinnGen Sandbox is a secure, scalable environment for accessing individual-level data. It operates in a[ web browser](https://sandbox.finngen.fi/) or via[ an application](https://finngen.gitbook.io/finngen-handbook/working-in-the-sandbox/quirks-and-features/using-sandbox-as-a-chrome-application-full-screen-mode), ensuring data security and compliance with privacy regulations. Each FinnGen partner has its own Sandbox, where members can use individual virtual machines (IVMs) for research.

The Sandbox remains open for 24 hours by default and supports R and Python programming languages. Analyses can be run in IVMs or using [FinnGen Pipelines ](/working-in-the-sandbox/which-tools-are-available/pipelines)for large tasks. Costs vary, with GWAS runs costing 3-10 euros and storage at 0.03 € per gigabyte per month. Information on costs can be found under [Billing information and where to find more details](/working-in-the-sandbox/billing-information-and-where-to-find-more-details).

Sensitive individual level data must not be screenshotted or transferred outside the Sandbox. Text can be copied into the Sandbox but not out, ensuring data security. Data sharing within organizations is possible via the "red" bucket.

[Files can be uploaded via Google Cloud](https://finngen.gitbook.io/finngen-handbook/working-in-the-sandbox/quirks-and-features/how-to-upload-to-your-own-ivm-via-finngen-green) and downloaded after verification. Only aggregate-level <mark style="color:green;background-color:green;">green data</mark> can be exported.

<figure><img src="https://3072695768-files.gitbook.io/~/files/v0/b/gitbook-x-prod.appspot.com/o/spaces%2F-MhYL0UTLjqsuIdK0SSO%2Fuploads%2FsP1oFY39GvKLb7rj84t1%2Fsandbox.png?alt=media&amp;token=034721ee-830b-4aad-b542-8aa9be7ce724" alt=""><figcaption><p>FinnGen Sandbox architecture</p></figcaption></figure>

FinnGen data includes[ phenotype](https://finngen.gitbook.io/finngen-handbook/finngen-data-specifics/red-library-data-individual-level-data/what-phenotype-files-are-available-in-sandbox-1/detailed-longitudinal-data),[ laboratory](https://finngen.gitbook.io/finngen-handbook/finngen-data-specifics/red-library-data-individual-level-data/what-phenotype-files-are-available-in-sandbox-1/kanta-lab-values/data), [genomic ](https://finngen.gitbook.io/finngen-handbook/finngen-data-specifics/red-library-data-individual-level-data/genotype-data/types-of-genotype-files-available)and other omic data stored in specific directories in the Sandbox. Users with access to <mark style="color:red;background-color:red;">**red data**</mark> can find these files in the <mark style="color:red;background-color:red;">**red**</mark> and <mark style="color:green;background-color:green;">**green**</mark> libraries. Check out this short video about [FinnGen Sandbox architecture: libraries, buckets and data](https://vimeo.com/625400442/3d42458442?share=copy).

Many of the <mark style="color:red;background-color:red;">**red data**</mark> types are also available in the [FinnGen BigQuery database](/working-in-the-sandbox/which-tools-are-available/bigquery-relational-database), integrated with the Sandbox. This serverless data warehouse supports eg. efficient SQL queries. A list of additional tools available in the Sandbox can be found from[ here](https://finngen.gitbook.io/finngen-handbook/tool-catalog).

<br>


# I'm new to FinnGen, where is the best place for me to start?

### How to get started

For a start, see what kind of data is available in FinnGen for you to plan your FinnGen Analysis. FinnGen has[ health registry data](/finngen-data-specifics/finnish-health-registers-and-medical-coding/finnish-health-registers) combined with [imputed genotype](/background-reading/imputation) data. The registry and genotype data are available in a secure [Sandbox ](/working-in-the-sandbox/how-to-get-started-with-sandbox)and are also used to make [FinnGen endpoints](/finngen-data-specifics/endpoints) for [FinnGen core analyses](/finngen-data-specifics/green-library-data-aggregate-data/what-is-green-data) for several conditions.

### Browse using Risteys

You can browse FinnGen Endpoints using [Risteys](https://risteys.finngen.fi/) and we recommend reading the section [using Risteys as an Endpoint browser](/working-outside-the-sandbox/risteys-as-an-option-for-browsing-endpoints). This can be done without applying for any special permissions. (Note that you can write ICD10 codes directly into the Risteys search bar to see which Endpoints they are contained in)

### Browse using PheWeb

From Risteys you can click directly to the ready-made association analyses at [the FinnGen PheWeb](https://results.finngen.fi/) to see if the condition you are interested in is already included in FinnGen core analyses. If you have not looked at [Manhattan plots](/faq/about-pheweb/what-are-qq-and-manhattan-plots) and association data we recommend the section on [how to use PheWeb](/working-outside-the-sandbox/link-to-how-to-use-pheweb). We also recommend reading the [GWAS Analysis ](/background-reading/gwas-analysis)section. (In the ["Background Concepts"](/background-reading) you will find suggestions for background reading on other genetic concepts as well.)

### How to access FinnGen results and data

* You can see FinnGen aggregate level results older than one year publicly [online](https://www.finngen.fi/en/access_results).
* The most recent aggregate data (GWAS results and other results computed from at least 5 individuals) can be viewed by [applying for "green level"](/faq/about-finngen-access-and-accounts/where-do-i-apply-for-data-access) data. This can also be [downloaded from our green library](/finngen-data-specifics/green-library-data-aggregate-data/how-can-you-download-green-data) once you have access.
* [Individual-level data](/working-in-the-sandbox/what-do-we-mean-by-red-and-green-data) is only accessible within the secure [Sandbox](/working-in-the-sandbox) environment. To work with this data you must [apply for red-level data access](/faq/about-finngen-access-and-accounts/where-do-i-apply-for-data-access), a process that can take 1-4 months on average. The [cost of the Sandbox](/working-in-the-sandbox/billing-information-and-where-to-find-more-details) is defined per Sandbox and by use.

### What to do if the condition is not available

If the condition you are interested in is not in the FinnGen endpoints and red-level access, you can build your case-control cohorts in [Sandbox](/working-in-the-sandbox/how-to-get-started-with-sandbox) by following the [custom endpoint creation instructions](/where-to-begin.../how-do-i-make-a-custom-endpoint). [**Atlas**](/working-in-the-sandbox/which-tools-are-available/atlas) conducts searches on [detailed longitudinal data](/finngen-data-specifics/red-library-data-individual-level-data/what-phenotype-files-are-available-in-sandbox-1/detailed-longitudinal-data) including [these registers](/finngen-data-specifics/red-library-data-individual-level-data/what-phenotype-files-are-available-in-sandbox-1/registers-in-the-detailed-longitudinal-data). Note that before beginning such an analysis, you should submit a [FinnGen Analysis Proposal](/finngen-data-specifics/about-analysis-proposals/when-do-i-need-to-submit-an-analysis-proposal) and check [that there are no overlapping analyses](/faq/about-finngen-access-and-accounts/how-can-i-view-existing-analysis-proposals) that already exist.

### Your FinnGen Analysis proposal has been approved

Once your FinnGen Analysis Proposal has been approved, see instructions on [how to define a cohort in Atlas](/working-in-the-sandbox/which-tools-are-available/atlas/detailed-guide/how-to-define-a-cohort-in-atlas) and subsections about [filtering criteria](/working-in-the-sandbox/which-tools-are-available/atlas/detailed-guide/how-to-define-a-cohort-in-atlas/cohort-definitions/filter-by-clinical-registries-in-atlas) and [code types](/working-in-the-sandbox/which-tools-are-available/atlas/detailed-guide/code-sets-in-atlas) options. Selecting cases and controls is an important step. See guidelines on [how to select controls for your cases](/working-in-the-sandbox/working-with-phenotype-data/how-to-select-controls-for-your-cases). You can also [modify existing endpoints](/faq/about-atlas/can-i-use-finngen-endpoints-like-medical-codes-in-atlas) (not available for all endpoints). After case-control cohorts are made [custom GWAS](/working-in-the-sandbox/which-tools-are-available/untitled) can be run using the [custom GWAS tool](broken://pages/-MhYMPpmLjq4WtP_ceMi) or from the [command line using finngen-cli tool](/working-in-the-sandbox/which-tools-are-available/untitled/custom-gwas-command-line-cli-tool).


# How to start using FinnGen individual-level data?

You can access FinnGen individual-level "red" data in the [FinnGen Sandbox](/faq/about-sandbox/background-of-data-safety-and-link-to-more-details) using your interactive virtual machine (IVM).

The use of FinnGen individual-level "red" data is only permitted for research purposes established in the FinnGen Scientific Plan and its amendments. You must make an [analysis proposal](/finngen-data-specifics/about-analysis-proposals/when-do-i-need-to-submit-an-analysis-proposal) before using this data in the Sandbox and before making a request to download aggregate-level "green" analysis results from the Sandbox. Please also familiarize yourself with FinnGen rules relating to [publishing results](/publishing-finngen-results).

Detailed information about the FinnGen data, including [phenotype](/finngen-data-specifics/red-library-data-individual-level-data/what-phenotype-files-are-available-in-sandbox-1) and [genotype](/finngen-data-specifics/red-library-data-individual-level-data/genotype-data) files, is available in the following section:

[FinnGen Data Specifics](/finngen-data-specifics)

Detailed information about the sandbox is available in the following section:

[Working in the Sandbox](/working-in-the-sandbox)

We encourage you to also check out background concepts in the following section:

[Background Concepts](/background-reading)


# What kind of questions can I ask of FinnGen data?

The **most typical research questions** focus on:

* **genetic drivers** of different health outcomes or other endpoints that can be formed based on registry data.
* **GWAS analyses** - comparing the allele frequencies between cases and controls (see [GWAS analysis](/background-reading/gwas-analysis)) - highlight the variants that are associated with specific endpoints.

### **PheWAS analyses**

When a variant of interest has been identified, PheWas analyses can provide more information about the health status of people who carry this variant. PheWas analyses help inform us about other diseases that are more common among individuals carrying the variant, thus giving potentially relevant information about underlying disease mechanisms.

Alternatively, the results can hint at the variant carriers being protected against another disease, or being otherwise particularly healthy. Such variants are especially interesting from a drug development viewpoint.

### Information FinnGen PheWeb provides

* frequency of a specific variant in cases and controls
* frequency of that variant in the general Finnish population
* possible enrichment compared to other populations

Finemapping is used to identify the most likely causal variant within a disease locus, and this data is also available through the PheWeb.

![Example questions one can ask of FinnGen data.](https://3072695768-files.gitbook.io/~/files/v0/b/gitbook-x-prod.appspot.com/o/spaces%2F-MhYL0UTLjqsuIdK0SSO%2Fuploads%2Fgit-blob-e87c6bedb246e3f322dd3929e2f35fcb427d040d%2FFinnGen%20R%26D.png?alt=media)


# How do I make a custom endpoint?

### Before you get started

Whether you are a clinician or an analyst, you might have a specific disorder of interest for which you would like to create an endpoint using your own criteria and be able to use that endpoint for downstream analyses. This is, in fact, very straightforward in FinnGen! However, **we recommend that you first take a look at the** [Risteys endpoint browser](https://risteys.finngen.fi/) to see if there already is an endpoint that suits your needs.

### Core endpoints

If you found the endpoint that you are interested in from Risteys, keep in mind that in FinnGen we have [core and non-core endpoints](/finngen-data-specifics/endpoints/where-the-finngen-endpoint-description-file-is-located/whats-new-in-df8-endpoints). [GWAS](/background-reading/gwas-analysis) are run only on core endpoints, so if your endpoint is a core endpoint, great! It already has PheWas results you can view in the [PheWeb browser](https://results.finngen.fi/), and you only need to follow that link to view and download its summary statistics. If the Risteys or PheWeb browsers are new to you, please take look at sections [How to use Risteys as an endpoint browser](/working-outside-the-sandbox/risteys-as-an-option-for-browsing-endpoints) and [How to use PheWeb](/working-outside-the-sandbox/link-to-how-to-use-pheweb).

### Non-core endpoint

However, if you're interested in a non-core endpoint or if you didn't find your favourite endpoint anywhere in [Risteys](https://risteys.finngen.fi/), you can still create your own endpoint or run your own [custom GWAS](/where-to-begin.../how-do-i-run-a-gwas-of-a-phenotype-i-create-myself) by following these instructions.

First, you should decide what your criteria are. How you would like to define your endpoint, and how specific would you like it to be?

* Which [Finnish Health Registers](/finngen-data-specifics/finnish-health-registers-and-medical-coding/finnish-health-registers) do you wish to use?
* Which [Register Codes](/finngen-data-specifics/finnish-health-registers-and-medical-coding/international-and-finnish-health-code-sets) from the Health Registers do you wish to use?

If you are not familiar with Finnish National Health Registers and the register codes used in them, see sections [Finnish Health registers](/finngen-data-specifics/finnish-health-registers-and-medical-coding/finnish-health-registers) and [International and Finnish Health code sets](/finngen-data-specifics/finnish-health-registers-and-medical-coding/international-and-finnish-health-code-sets).

### Selecting Health Register and Register codes

We recommend selecting register codes with help of medical professionals, who better understand how codes are used and how register data was collected for specific codes.

#### **Finnish health code sets**

It is especially important to understand explicitly [Finnish health code sets](/finngen-data-specifics/finnish-health-registers-and-medical-coding/international-and-finnish-health-code-sets). Some register codes are Finnish-specific, meaning that they differ from their corresponding international codes, so it's important to check that you are using the correct codes from the correct code sets. For example, Finnish versions of ICD-[8](https://www.julkari.fi/handle/10024/135324)/[9](https://www.julkari.fi/handle/10024/131850)/[10](https://www.julkari.fi/handle/10024/80324) **are not** the same as the US clinical versions, nor do they map exactly to the [WHO ICD](https://version.helsinki.fi/ontology-group/ontologists/-/wikis/uploads/10e1070d546c2e0a514b2675b1080b35/ICD-10-WHO-2016.pdf) (although the Finnish versions do extend and modify the WHO versions). Take a look at the section [Register code translation files available in Sandbox](/finngen-data-specifics/finnish-health-registers-and-medical-coding/where-to-find-the-translation-file-for-phenotype-data) to find out where you can find code translation files if you aren't comfortable in Finnish. From those files you can find the condition(s) you are interested in, and the codes that map on to them.

When you are certain about what registers and register codes you would like to use to define your endpoint, you can create your custom endpoint using [Atlas](/working-in-the-sandbox/which-tools-are-available/atlas), or by using R in the Sandbox if you prefer (and have more experience).

### Create a custom endpoint using Atlas

1. Launch Atlas by going to the *Applications* menu in Sandbox and selecting FinnGen > Atlas.
2. In the section [How to define a cohort in Atlas ](/working-in-the-sandbox/which-tools-are-available/atlas/detailed-guide/how-to-define-a-cohort-in-atlas)you can find detailed instructions on defining your case and control cohorts for analysis. These cohorts can then be used to define an endpoint, and you can run, for example, a GWAS using FinnGen's [Custom GWAS tool](/working-in-the-sandbox/which-tools-are-available/untitled) or [Cohort Operations](/working-in-the-sandbox/which-tools-are-available/cohort-operations-tool-co) tool to analyse them.

When using Atlas for creating an endpoint, you can use registers that are in the [Detailed longitudinal data file](/finngen-data-specifics/red-library-data-individual-level-data/what-phenotype-files-are-available-in-sandbox-1/detailed-longitudinal-data) found in [Sandbox](/working-in-the-sandbox). [Other registry data files that are in Sandbox](/finngen-data-specifics/red-library-data-individual-level-data/what-phenotype-files-are-available-in-sandbox-1/other-registers) are not yet implemented for use by Atlas, and thus if you wish to use them you will have to use R.

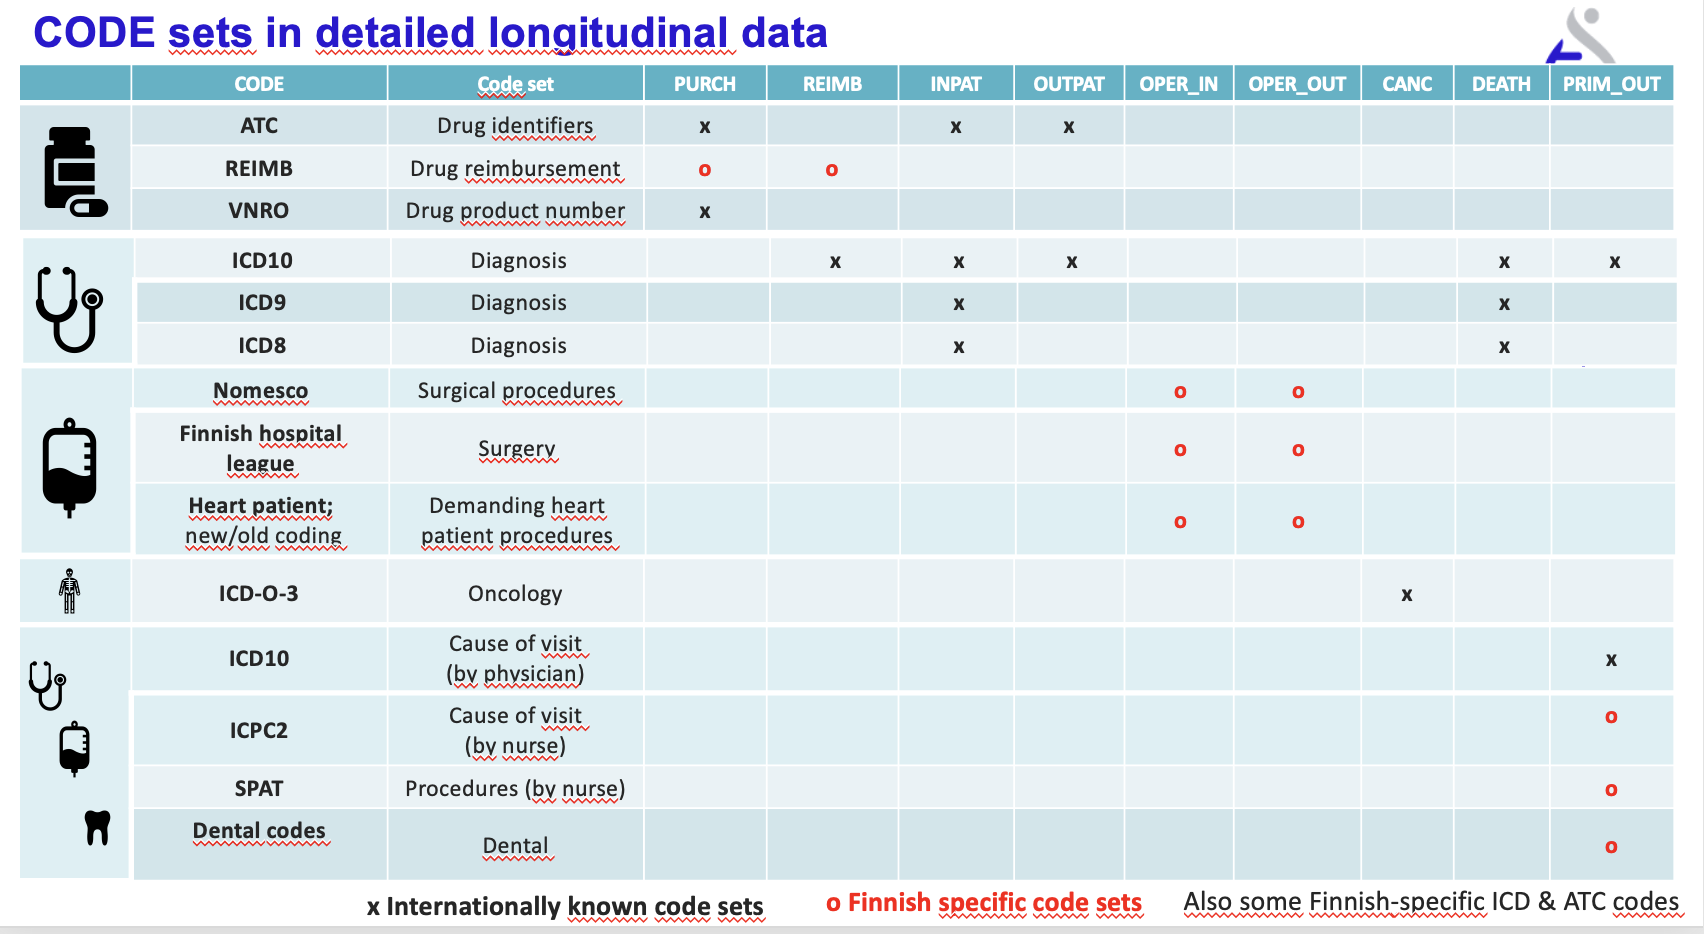
#### [Detailed longitudinal data](/finngen-data-specifics/red-library-data-individual-level-data/what-phenotype-files-are-available-in-sandbox-1/detailed-longitudinal-data) contains the following Finnish Health Registers:

* Hilmo inpatient data and specialist outpatient data
* Primary care data
* KELA drug purchases and reimbursement data
* Cancer register data
* Cause of death register data

For more information, see the section [How do I run a GWAS of a phenotype I create myself](/where-to-begin.../how-do-i-run-a-gwas-of-a-phenotype-i-create-myself). See also [General workflows for the most common analyses](/working-in-the-sandbox/general-workflows-for-the-most-common-analyses) researchers are conducting in the Sandbox with the FinnGen data.

### Creating your own endpoint using R

Creating an endpoint using [other Registers in Sandbox](/finngen-data-specifics/red-library-data-individual-level-data/what-phenotype-files-are-available-in-sandbox-1/other-registers) will require some programming skills and experience using R. We have [code snippets of R](/working-in-the-sandbox/which-tools-are-available/miscellaneous-helper-scripts-tools/bigquery-connection-r) and [Python](/working-in-the-sandbox/which-tools-are-available/miscellaneous-helper-scripts-tools/tool-to-annotate-variants-with-rsids-1) that can help you with this in `/finngen/library-green/scripts/code_snippets`. The section [How to check case counts from the data](/working-in-the-sandbox/working-with-phenotype-data/how-to-check-case-counts-from-the-data) shows several example commands that you can use. Though this will require more effort, after you've created an endpoint successfully, you can run any analyses you like with it (see [How do I run a GWAS of a phenotype I create myself](/where-to-begin.../how-do-i-run-a-gwas-of-a-phenotype-i-create-myself)). Also be careful using R to select not only the codes of interest but also the code set - e.g. in ICD10 F29 = psychosis but in the ICPC2 code set F29 = eye discomfort.


# How do I run a GWAS of a phenotype I created myself?

### Custom GWAS tool

When you have successfully created your own endpoint by following the instructions in [How to make a custom endpoint](/where-to-begin.../how-do-i-make-a-custom-endpoint), you might then want to run a GWAS on it.

The easiest way to run a GWAS, without any programming experience, is to use the [Custom GWAS tool](/working-in-the-sandbox/which-tools-are-available/untitled) or [Cohort Operations](/working-in-the-sandbox/which-tools-are-available/cohort-operations-tool-co) tool. The [Custom GWAS tool](/working-in-the-sandbox/which-tools-are-available/untitled) sections will walk you through how to run your GWAS using the [case and control cohorts](/working-in-the-sandbox/which-tools-are-available/atlas/detailed-guide/how-to-define-a-cohort-in-atlas) that you created using [Atlas](/working-in-the-sandbox/which-tools-are-available/atlas). The same Custom GWAS can also be launched from the [Cohort Operations](/working-in-the-sandbox/which-tools-are-available/cohort-operations-tool-co). The section [General workflows for the most common analyses](/working-in-the-sandbox/general-workflows-for-the-most-common-analyses) describe the most common workflows researchers are conducting in the Sandbox with the FinnGen data. These methods need no programming skills.

### Command Line

If you are more skilled at programming, or if you did not create your endpoint using Atlas, you can run GWAS using the command line. Take a look at the section [How to run genome-wide association studies (GWAS)](/working-in-the-sandbox/running-analyses-in-sandbox/how-to-run-genome-wide-association-studies-gwas). The section starts with advice on how to choose a program to use for analysis based on your needs, and continues to sections instructing how to run GWAS in [Regenie](/working-in-the-sandbox/running-analyses-in-sandbox/how-to-run-genome-wide-association-studies-gwas/how-to-run-gwas-using-regenie), [Saige](/working-in-the-sandbox/running-analyses-in-sandbox/how-to-run-genome-wide-association-studies-gwas/how-to-run-gwas-using-saige), [Plink2](/working-in-the-sandbox/running-analyses-in-sandbox/how-to-run-genome-wide-association-studies-gwas/how-to-run-gwas-using-plink2-for-unrelated-individuals-only), and [Gate](/working-in-the-sandbox/running-analyses-in-sandbox/how-to-run-genome-wide-association-studies-gwas/how-to-run-gwas-using-gate-survival-models).

It is recommended you also read sections [Pipelines are based on Cromwell and WLD](/working-in-the-sandbox/running-analyses-in-sandbox/pipelines-tool-instructions/pipelines-is-based-on-cromwell-and-wdl) and [How to use the Pipelines tool](/working-in-the-sandbox/running-analyses-in-sandbox/pipelines-tool-instructions/how-to-use-the-pipelines-area), because you will need these instructions to be able to run your GWAS in [Sandbox](/working-in-the-sandbox).


# I'm interested in FinnGen rare variant phenotypes

The FinnGen project is fortunate to have >116k rare coding variants included, many of which are variants specific to the [Finnish population bottleneck](https://github.com/finngen-user-documentation/Draft_of_FG_Analyst_Handbook/blob/master/where-to-begin.../broken-reference/README.md). The section [Genotype Arrays Used](/finngen-data-specifics/red-library-data-individual-level-data/genotype-data/affymetrix-chip-and-its-design) describes the design and contents of the genotyping chip in more detail.

### Variants

One advantage of FinnGen is that Finnish clinicians can use FinnGen to check variants they may have found in screening Finnish families to help determine if they are causative. Since these are Finnish-specific variants, they are often not found in more international resources such as ClinVar.

Variants can be classified by their **frequency**:

* **Common variant** refers to variants **> 1%** and these will be most commonly found as imputed variants.
* **Low-frequency variant** refers to variants with **0.1-1%** frequency in the population. These are usually run on the chip but sometimes are common enough that they may also be [imputed](/background-reading/imputation).
* **Rare variant** usually refers to variants with **<0.1%** frequency in the population. These are usually available only in chip data.

(Ultra-rare variants are usually not present and FinnGen does not run gene-level burden tests such as SKAT-O. You can check [Genebass](https://genebass.org/) for burden information of ultra-rare variants in UKBB, although this does not contain FinnGen data, it will give you an idea of the values in other populations.)

### Available tools

Which tools are available depend on the frequency of the variant. Below is a map of tools.

Data availability:

* Green boxes = [green data access,](/faq/about-finngen-access-and-accounts/do-i-need-red-or-green-data-access)
* Red boxes = [red-level Sandbox access](/faq/about-finngen-access-and-accounts/if-i-already-have-green-data-access-how-do-i-apply-for-red).

<figure><img src="https://3072695768-files.gitbook.io/~/files/v0/b/gitbook-x-prod.appspot.com/o/spaces%2F-MhYL0UTLjqsuIdK0SSO%2Fuploads%2Fgit-blob-ff71faa1d7e6553eff0b978eb623cbbc932f5957%2Fimage%20(123).png?alt=media" alt=""><figcaption></figcaption></figure>

More about [Coding variant results including CHIP EWAS (Exome-Wide Association Scan)](/finngen-data-specifics/green-library-data-aggregate-data/core-analysis-results-files/chip-gwas) and Chip association browser <https://dev2.finngen.fi/>.

If you are interested in **all the coding variants in a particular gene**, you can go to [PheWeb](http://results.finngen.fi) and then just type in the name of your gene. At the bottom, you will see all the *imputed* variants and any associations they may have to FinnGen phenotypes. Here is what is shown for TSHR:

![Gene Level Table of coding variants from PheWeb](https://3072695768-files.gitbook.io/~/files/v0/b/gitbook-x-prod.appspot.com/o/spaces%2F-MhYL0UTLjqsuIdK0SSO%2Fuploads%2Fgit-blob-67277b8241897a449715591e0bb782776e845333%2Fimage%20\(70\).png?alt=media)

Currently, to work with rarer variants you will need red-level Sandbox access.

### How to work with rarer variants

* **Check genotyping quality via the** [**Cluster Plots**](/working-in-the-sandbox/working-with-genotype-data/cluster-plots). (You can find all the cluster plots from the [**green library**](/finngen-data-specifics/green-library-data-aggregate-data), but you will not be able to fix the calls or run a phenotypic analysis without red-level access.) Or use the [**Genotype Browser how to**](/working-in-the-sandbox/working-with-genotype-data/genotype-browser) to view cluster plots and [**Rare Variant Calling in V3**](/working-in-the-sandbox/working-with-genotype-data/rare-variant-calling-in-v3c) to fix calls manually.
* **Look** at your variant **in the public resource** [**Gnomad**](https://gnomad.broadinstitute.org/) and check that it has been seen in Finland and what its allele frequency is. This can help you estimate if you have the correct number of heterozygotes (Finnish allele frequency from Gnomad v2 [**number of individuals in current data freeze**](/finngen-data-specifics/finngen-data-freezes-and-releases) = roughly the number of copies/hets for a rare or low frequency variant)
* **Run** [**CodeWas**](/working-in-the-sandbox/which-tools-are-available/cohort-operations-tool-co/explore-code-and-endpoint-enrichments-with-co) with [**Cohort Operations tool**](/working-in-the-sandbox/which-tools-are-available/cohort-operations-tool-co) to see which medical codes and FinnGen endpoints the variant is associated with. Use of Cohort Operations needs no coding skills. The other option to explore medical codes and FinnGen endpoints association is to run a PheWAS (see the section [**Variant PheWas**](/working-in-the-sandbox/working-with-genotype-data/variant-phewas) and note also that we have a section on [**Interpreting rare-variant analysis results**](/working-in-the-sandbox/working-with-genotype-data/interpreting-rare-variant-analysis-results)). Running PheWAS requires some experience with R programming.
* See also [**General workflows for the most common analyses**](/working-in-the-sandbox/general-workflows-for-the-most-common-analyses) describing the most common workflows researchers are conducting in the Sandbox with the FinnGen. The methods described for **genotype variant analysis** suits also for exploring rare variants. These methods need no programming skills.

Using Sandbox requires red-level access.

![Gnomad variant display](https://3072695768-files.gitbook.io/~/files/v0/b/gitbook-x-prod.appspot.com/o/spaces%2F-MhYL0UTLjqsuIdK0SSO%2Fuploads%2Fgit-blob-e68cce09d90b9c4b74f8ea2078e2ffdfa8ea5cea%2Fimage%20\(308\).png?alt=media)


# Background Concepts

FinnGen data analysts are from a variety of backgrounds - some more clinical, some more bench science, and some more computational.

![](https://3072695768-files.gitbook.io/~/files/v0/b/gitbook-x-prod.appspot.com/o/spaces%2F-MhYL0UTLjqsuIdK0SSO%2Fuploads%2Fgit-blob-945a9b770a164d050a66ba695c0d7e444735ee62%2Fkuva%20\(7\).png?alt=media)

Here we have gathered some of our internally recommended resources if some topics are unfamiliar to you:

* [**Basics of Genetics**](/background-reading/genetics-basics)
* [**Linkage Disequilibrium**](/background-reading/linkage-disequilibrium-ld) **(LD)**
* [**Genotype Imputation**](/background-reading/imputation)
* [**Genotype Data Processing and Quality Control**](/background-reading/genotype-process) **(QC)**
* [**GWAS Analysis**](/background-reading/gwas-analysis)
* [**P Values**](/background-reading/p-values)
* [**Heritability and genetic correlations**](/background-reading/heritability-and-genetic-correlations)
* [**Finemapping**](/background-reading/finemapping)
* [**Colocalization**](/background-reading/colocalization)
* [**Using Polygenic Risk Scores**](/background-reading/using-prs-data)
* [**PheWAS Analysis**](/background-reading/phewas-analysis-compared-to-gwas)
* [**Longitudinal Data Analysis**](/background-reading/references-on-longitudinal-data-analysis-ohdsi-soren-brunak)
* [**Introduction to Atlas**](https://github.com/finngen-user-documentation/Draft_of_FG_Analyst_Handbook/blob/master/background-reading/broken-reference/README.md)
* [**GWAS Association to Biological Function**](/background-reading/gwas-association-to-biology)
* [**Genetic Data Resources outside of FinnGen**](/background-reading/genetic-data-resources)
* [**Getting Started with Unix**](/background-reading/how-to-get-started-with-unix)
* [**Getting Started with R**](/background-reading/how-to-get-started-with-r)


# Basics of Genetics

Considering that the data that you will be working on is genetic data, getting the basic concepts of genetics will be important.

We suggest the

* **Khan Academy provides general information** on [classical genetics](https://www.khanacademy.org/science/biology/classical-genetics) and [allele frequencies](https://www.khanacademy.org/science/ap-biology/natural-selection/hardy-weinberg-equilibrium/v/allele-frequency).
* One of **our** **personal favourites for** [**primers on genomics**](https://www.genome.gov/About-Genomics/Introduction-to-Genomics) on the National Human Genome Research Institute (USA).
* An **excellent overview of genomics** and the analytics of genomics found here: [Analytic and Translational Genetics by Karczewski and Martin (2020) Annual Review of Biomedical Data Science](https://ibg.colorado.edu/cdrom2021/Day08-veerapan/2021_IBG_Hail/Materials/additionalMaterial/annurev-biodatasci-072018-021148.pdf)

For more in-depth information we also highly recommend Matti Pirinen's [GWAS course materials](https://www.mv.helsinki.fi/home/mjxpirin/GWAS_course/).


# Linkage Disequilibrium (LD)

Linkage disequilibrium (LD) across chromosomal regions **is manifested by non-random association of alleles at different loci in a given population or datasets**. Alleles in different loci are said to be in LD when the frequency of association of their different alleles is higher or lower than what would be expected if the loci were fully independent and associated randomly.

In the figure below (adapted from [here](https://www-nature-com.ezp-prod1.hul.harvard.edu/articles/nrg777)), a variant on the ancestral chromosome is represented by a red triangle. **The alleles that are physically close tend to stick with the ancestral variant** despite recombination limits for the region in which the variant is at (the yellow region).

![Adapted from Ardlie, Kruglyak, and Sielestad (2002) Nature Genetics Review](https://3072695768-files.gitbook.io/~/files/v0/b/gitbook-x-prod.appspot.com/o/spaces%2F-MhYL0UTLjqsuIdK0SSO%2Fuploads%2Fgit-blob-b8efea3cecc01e005e80937b36aba0140fa3de1b%2F41576_2002_article_bfnrg777_fig1_html.webp?alt=media)

### Influences

Linkage disequilibrium is influenced by many factors:

* Selection
* Rate of genetic recombination
* Mutation rate
* Genetic drift
* System of mating
* Population structure
* Genetic linkage.

As a result, the pattern of linkage disequilibrium in a genome is a powerful signal of the population genetic processes that are structuring it.

Read more detailed information about LD from Matti Pirinen's course [slides](https://www.mv.helsinki.fi/home/mjxpirin/GWAS_course/material/GWAS7_slides.pdf) and [notes](https://www.mv.helsinki.fi/home/mjxpirin/GWAS_course/material/GWAS7.pdf).


# Genotype Imputation

Genotype imputation is a computational method for statistically inferring untyped genotypes in a sample of partially genotyped individuals. The imputation process uses LD and haplotype sharing/similarity to infer genotypes of a lower-density (e.g. chip-genotyped) **target** dataset from the **reference dataset** of more densely genotyped individuals, e.g from a whole-genome sequencing data based **imputation reference panel** (IRP).

The figure below shows diagramatically how genotype imputation works in unrelated individuals (adapted from the Abecasis group's review paper found [here](https://www.ncbi.nlm.nih.gov/pmc/articles/PMC2925172/)).

#### Panel A

Study samples (*Panel A*) has sparse genotypes which is then "filled in" (imputed) for the missing sparsity of the genotypes (*Panel B*).

#### Panel B

Depending on the data, you can impute stretches of up to >100 kb in length and of a minor allele frequency of down to 5-10%. With FinnGen, all of our data is imputed with a Finnish specific population imputation panel to resolve into much higher resolutions.

#### Panel C

The final product of genotype imputation is shown in *Panel C* to fill in the series of unobserved genotypes that was in the study sample.

![Adapted from Li, Willer, Sanna, and Abecasis (2009) Annu Rev Genomics Hum Genet.al.](https://3072695768-files.gitbook.io/~/files/v0/b/gitbook-x-prod.appspot.com/o/spaces%2F-MhYL0UTLjqsuIdK0SSO%2Fuploads%2Fgit-blob-65c27bcfc4f1f55cc946ee596ee2910da8de68b4%2Fnihms-226475-f0002.jpeg?alt=media\&token=556443fc-39a9-424d-bdee-8ccc436a3404)

With genotype imputation, geneticists can now study variants that have not been directly genotyped in studied samples; therefore, increasing the power and resolution of[ genome-wide association studies (GWAS)](/background-reading/gwas-analysis) and meta-analyses: especially for combining association results across studies which use different genotyping arrays. Moreover, genotype imputation can be used to facilitate improvements in [fine-mapping](/background-reading/finemapping) in order to localise association signals by considering all genetic variants in a certain region.

With the increased availability of various genotype imputation-related tools and Whole Genome Sequencing (WGS) based reference datasets, this practice has become widespread as it offers a cost-effective alternative to purely WGS-based study designs, especially when considering analyses of very large sample sets.

In FinnGen, we utilize [Beagle](https://faculty.washington.edu/browning/beagle/b4_1.html) to perform genotype imputation. Prior to utilizing Beagle for genotype imputation of FinnGen target datasets (comprising of ‘*legacy*’ datasets genotyped with various chip arrays and samples genotyped with ThermoFisher FinnGen Affymetrix genotyping chips), high-quality WGS based variant alleles are [phased](https://isogg.org/wiki/Phasing) with [Eagle](https://alkesgroup.broadinstitute.org/Eagle/) to develop the IRPs.

## **Single Nucleotide Polymorphism (SNP) and Insertion-Deletion (indel) Imputation**

Both SNPs (somethings known as SN Variants a.k.a SNV) and indels in FinnGen are currently imputed from the [SISu](http://sisuproject.fi) v3 IRP, comprising of 3,775 whole-genome sequenced (\~30x coverage) Finns and containing 16.9M variants.

We are currently in the progress of shifting over to the SISu v4 IRP, comprising of 8,554 whole-genome sequenced Finns.

To note, imputation with an ancestry specific reference panel e.g. SISu IRP, has been shown to improve genetic associations, especially of rare variants (as noted [here](https://www.biorxiv.org/content/10.1101/579201v2.full)).

## **Short Tandem Repeat (STR) or Simple Sequence Length Polymorphism (SSLP) Imputation**

Both STRs and SSLPs, or microsatellites are one of the most plentiful source of variation in the human genome. These variants are strings of consecutively repeated, approximately 2-6 nucleotide sequence motifs that are repeated from a few to hundreds of copies (often written (CA)n, (GTT)n, (GATA)n, etc.) in which the length (number of repeats) is polymorphic in the population.

Repeat length expansion is widely studied as the genetic cause of many neurodegenerative conditions (usually caused by expansions within the coding regions of genes). However, these STRs are largely unexplored in GWAS since they are not well-called in the default short read sequencing analysis pipelines and not imputed well (like HLA typing variation, these are single variants where each individual has two alleles drawn from a population set of more than 2 possible alleles – not ‘binary’ variants like SNPs and single indels). Hence, like HLA, both the calling of these variants in the reference data, and then the imputation and association analysis, are slightly different.

In FinnGen, we will use a SSLP/STR reference panel developed from the same WGS data (for \~8,000 Finns) that was used to develop the SISu v4 SNV/indel reference panel. High-quality SSLP/STR calls are merged with biallelic SNV calls for the same individuals (from the SISu v4 SNV/indel reference panel) and phased. The resulting reference panel (now containing also SSLP/STR variants) will be used to carry out SSLP/STR imputation for all FinnGen chip datasets. We expect this data will be available in autumn 2021.

### More information and diagrams:

The presentation “*Genotype Imputation*” is available in [Documentation folder](https://drive.google.com/drive/folders/1dGIjtrPce-XwY_zuI5rzf4MeQgpETmYi).

[Click here to read more about Sisu imputation panel used in the FinnGen](/finngen-data-specifics/red-library-data-individual-level-data/genotype-data/imputation-panel)


# Genotype Data Processing and Quality Control (QC)

Genotype data is a relatively cheap and scalable way to characterize the genetic variants from DNA samples. Genotyping relies on prior knowledge of the genome, because the technology queries only particular coordinates in the genome where known variation exists. It differs from sequencing, where the full sequential order of bases is characterized.

In comparison, sequencing a human genome would require sequencing approx. 3 billion bases, but genotyping using a chip or array typically covers half a million to a million base coordinates distributed around the genome.

### Imputation

Genotyping doesn’t cover the whole catalog of variation in a person’s genome, but the selection of variants chosen to be covered by the array typically provides enough information to statistically infer the remaining variation by[ imputation](/background-reading/imputation), due to [linkage disequilibrium](/background-reading/linkage-disequilibrium-ld), i.e. some variants tend to be inherited together.

### Genotyping

Genotyping starts from the genotyping lab, where extracted DNA is fragmented and washed onto a chip typically containing engineered, complementary base pair fragments that flank the immediate region around the known variant location (Figure: *Target prep*). The DNA fragments hybridize (Figure: *Hybridization*) with these complementary sequences, and with varying technological solutions e.g. fluorescence intensity measurements.

![Adapted from : https://www.affymetrix.com/products\_services/arrays/specific/axiom\_mydesign.affx](https://3072695768-files.gitbook.io/~/files/v0/b/gitbook-x-prod.appspot.com/o/spaces%2F-MhYL0UTLjqsuIdK0SSO%2Fuploads%2Fgit-blob-303e0f31127bde9659ea61271389ebc045532ced%2Fimage%20\(491\).png?alt=media)

Finally, upon Figure: *Signal amplification,* the captured data can be processed by genotype calling software to result in the output being genotypes from the DNA sample where

```
0|0 = homozygous wildtype
0|1 = heterozygous for the variant, or
1|1 = homozygous for the variant
```

The researcher typically gets a file with data from all samples processed by the lab combined into one file with the genotypes data for all variants on the chip.

### Quality Control

Before analysis, it is important that the data are passed through a number of quality control (QC) steps so that the results are not confounded by e.g. technical artifacts or biases in the sample population. The QC is typically split into sample level and variant level QC. A great overview of the process with some example commands [here](https://pubmed.ncbi.nlm.nih.gov/21085122/) (PMID 21085122).

**Variant QC**

* aims to remove specific variants that have issues with quality. One of the most important steps is the removal of variants that are missing (i.e. not called) in a larger proportion of the samples from the dataset than a set threshold, e.g. "*missingness*" in 2% or more samples. Low call rates can be due to several reasons, e.g. that the hybridization process did not work accordingly, or that the automated software that calls the genotypes was not able to deduce the genotypes accurately.

**Sample level QC**

* aims to remove specific samples that for one reason or another have poor quality data or where the genetically inferred information does not correspond to information known prior to genotyping.
* A typical data-related filter is to remove samples where a set % of variants for the sample are missing, i.e. a genotype was not called at many locations. A typical threshold for removing a sample is e.g. **2% or more of variants missing from the genotype calls**.
* Another important step is to **infer the sex of the sample** from the genetic data using the rate of homozygosity/heterozygosity on the X-chromosome. If the genetically inferred sex is discordant with the reported sex in the phenotype information typically accompanied with sample (e.g. reported by the clinician referring a patient to the study), this can imply e.g. a sample swap or mistake in the accompanied phenotype information. Neither of these is uncommon, especially in larger studies.
* Another important sample level check is a **duplicate sample / genetic relatedness check**. Unintended duplicates (or twins) are easy to detect, as the genetic variants are (nearly) identical. This can happen e.g. during sample preparation, in the lab or if the same person is enrolled in the same study twice (e.g. at two different clinics). Typically one sample is kept in the data. In the same way that duplicates are inferred, the proximity of the relation between non-duplicated samples can be estimated from the genetic variants using the basic Mendelian inheritance expectations: e.g. parent-child or sibling pairs will share on average 50% of their chromosomes, which is reflected in the genotype data. Genetic relatedness is checked for all sample pairs. Previously, genome-wide association studies were regularly carried out using samples that were not closely related to each other, but recently statistical analysis methods are used where the genetic relatedness is controlled, resulting in fewer samples being removed from the data.
* Another typical check has been the removal of samples that have a **high or low proportion of heterozygous genotypes (e.g. +/3 standard deviations from the mean)**. Low heterozygosity can imply autozygosity, and high heterozygosity can imply admixture. Even without using this method for sample filtering, it is a good check for understanding the genetic landscape of the study population.

### Genetic ancestry of the study population

Finally, an important aspect to consider (which related to the previous topics like relatedness) is the genetic ancestry of the study population. Samples from the same ancestral population are more similar to each other, and allele frequencies of variants can be significantly different between populations. For example, if comparing cases from one population to controls from another (or even groups from different geographical locations from the same ancestral population), spurious associations can arise that have no relation to the case/control status, but instead are markers of differential genetic ancestry.

![](https://3072695768-files.gitbook.io/~/files/v0/b/gitbook-x-prod.appspot.com/o/spaces%2F-MhYL0UTLjqsuIdK0SSO%2Fuploads%2Fgit-blob-645f23ebc8e2533b06ac2954ba04907646d8df67%2Fkuva%20\(14\).png?alt=media)

**Figure 1. Spurious associations can arise if no control for differential genetic ancestry is applied.** **A.** In this example, it would appear that the cases (each individual sample is a circle) are carriers of the allele more frequently than the controls are.

![](https://3072695768-files.gitbook.io/~/files/v0/b/gitbook-x-prod.appspot.com/o/spaces%2F-MhYL0UTLjqsuIdK0SSO%2Fuploads%2Fgit-blob-7044ea0769bfea0b29cc68f4290e034816e09e9c%2Fkuva%20\(49\).png?alt=media)

**B.** Upon closer inspection, when separating the cases and controls by geographical location of the recruiting hospital, it is found that the cases and controls carry the allele at equal frequencies. The allele is simply less common in the geographically more Northern populations. Because the majority of the controls were from this population, the overall allele frequency in the controls group was lower compared to the case group, who were mainly representatives of the more Southern genetic ancestry.

### Projection principal component analysis (PCA)

Reference populations such as [1000 Genomes](https://www.internationalgenome.org/) or [TOPMed](https://www.nhlbi.nih.gov/science/trans-omics-precision-medicine-topmed-program) contain genome data from carefully selected samples from many different geographical locations, which can be used as a reference “map” for the genetic signatures of different populations across the globe. We can then compare our own samples’ data to these reference samples and place our samples onto the “map”, using a method called projection principal component analysis (PCA).

You can read more about PCA from [Matti Pirinen's notes](https://www.mv.helsinki.fi/home/mjxpirin/GWAS_course/material/GWAS5_slides.pdf). Typically, in genome-wide association, polygenic risk score analyses, or genetic epidemiological analyses, we would add at least the 10 first principal components as covariates into the model.

Click here to read more about [genotype data processing in FinnGen](/finngen-data-specifics/red-library-data-individual-level-data/genotype-data/description-of-how-the-data-is-processed-in-refinery)


# GWAS Analysis

Genome-wide association studies, or GWAS, are one of the most common ways to analyze the statistical significance of genetic data. A GWAS statistically tests if a genetic variant occurs more frequently in cases than controls. A FinnGen GWAS looks at millions of variants across the whole genome.

These studies typically compare the effect of variants across the genome on a desired phenotype, and their respective effects and significance thereof. Steps to conduct a GWAS is as diagramatically shown in an excellent paper that we recommend reading by [Uffelmann et al (2021) *Nature Reviews Methods Primers*](https://www.nature.com/articles/s43586-021-00056-9):

![Adapted from Uffelmann et al (2021) Nature Reviews Methods Primers](https://3072695768-files.gitbook.io/~/files/v0/b/gitbook-x-prod.appspot.com/o/spaces%2F-MhYL0UTLjqsuIdK0SSO%2Fuploads%2Fgit-blob-95484ee8818d3c1a160c63ca402e3e1e8c22956f%2Fimage%20\(777\).png?alt=media)

One of the simplest models to model GWAS data is with a linear model

y = µ+xβ + ε, where:

● *y* is the phenotype

● *x* is the genotype, coded as either 0, 1, or 2:

* 0 meaning the individual has no copies of the variant gene or homozygous reference,
* 1 meaning they are heterozygous, and
* 2 meaning they are homozygous variant

● µ is the mean value of individuals without the variant

● β is the effect each copy of the variant has on the mean phenotype

● ε is a normally distributed error term (a good estimate for most biological data).

If you have all of these, running a base GWAS and getting a P-value in using a commonly used statistical programming tool, R is as simple as running:

```
lm.fit = lm(y ~ x)
summary(lm.fit)
```

Which will output information about your dataset. For more information about R, see the [Getting Started with R](/background-reading/how-to-get-started-with-r) section.

**Note**: All GWAS results for all available endpoints/phenotypes from FinnGen is available in [FinnGen PheWeb](https://results.finngen.fi).

#### Additional reading

* [Uffelmann et al (2021) *Nature Reviews Methods Primers*](https://www.nature.com/articles/s43586-021-00056-9)*.*
* [GWAS Primer](https://www.genome.gov/about-genomics/fact-sheets/Genome-Wide-Association-Studies-Fact-Sheet), the National Human Genome Research Institute, USA.
* [Matti Pirinen’s Genome-wide Association Studies (course code: LSI34002) course](https://www.mv.helsinki.fi/home/mjxpirin/GWAS_course/) at the University of Helsinki provides an excellent introduction to the topic to those interested in a more in-depth look at running your own GWAS, and much of the background here was sourced from his [course notes](https://www.mv.helsinki.fi/home/mjxpirin/GWAS_course/material/GWAS1.pdf) which are free to use.

[Click here to read more about how you can run GWAS in Sandbox using FinnGen data](/working-in-the-sandbox/which-tools-are-available/untitled)


# P Values

P-values are most commonly used in **significance testing.** Specifically, they represent the probability of expecting to see a test statistic at least as extreme as yours under the default or null hypothesis.

The p-value is central to GWAS because the “*no-effect*” hypothesis (i.e., the genetic variant does not influence the phenotype being studied) is thought to be true for the vast majority of genetic variants tested, and testing “*effect*” versus “no effect” is well-served by calculating a p-value.

Because only a tiny fraction of genetic variants are associated, alternate approaches such as false discovery rate (FDR) methods and other Bayesian approaches estimating the proportion of true positives genome-wide are less commonly used in GWAS since they would add little additional value on top of this simple, frequentist formulation.

**Generally, we take very small p-values to be evidence that the null hypothesis may be false and therefore “*****rejected*****”, because observing this data under the null hypothesis would be extremely unlikely.**

There are several concepts and **considerations** that should be taken into account **when using this p-values:**

● **The null hypothesis**

The default null hypothesis in genetic studies is that your variant of interest does not influence (has an effect size of 0 on) your desired phenotype. In this way, each of your variants will have its own null hypothesis if you are testing more than one.

● **Possible errors**

In statistics there are typically two types of errors that are referred to: A false positive where someone rejects the null hypothesis despite it being true, or a **Type I Error**, and someone failing to reject the null hypothesis despite it being false, or a **Type II Error.**

● **The significance threshold α**

In many contexts, a standard significance threshold (**α**) for p-values is 0.05, or 1 in 20, which means that we mark all p-values less than that as potentially showing this data not operating under the null hypothesis. However, when doing a GWAS, we are performing association tests on millions of variants – and if a such a liberal threshold is selected, 1 out of every 20 tests will have the null hypothesis falsely rejected. Therefore, a “*genome wide significant*” threshold is typically around 5 x 10$$^{-8}$$ (which is where you’ll see a line when browsing Manhattan plots on the[ FinnGen PheWeb](https://results.finngen.fi)).

For a derivation of this threshold, which corresponds to .05 / 1 million independent tests, see [Pe’er et al. Genet Epidemiol. 2008 May;32(4):381-5. PMID: 18348202](https://onlinelibrary.wiley.com/doi/abs/10.1002/gepi.20303)

● **P-value corrections**

While adding another level of computation, corrections made to your p-value statistic in their many forms are very important. There are numerous different methods to improve the accuracy of your statistics (the family-wise error rate correction family-wise error rate correction for **α,** and the [Bonferroni correction](https://mathworld.wolfram.com/BonferroniCorrection.html) for p, are two of the most common). Various scaling approaches may be used on the distribution wholesale in the event that there is systematic inflation of statistics which might arise, for example, from uncorrected population structure or cryptic relatedness.

A common misconception is that the p-value is the probability that the null hypothesis is true, or that the p-value represents the effect size in your data. Neither of these is true: under this frequentist formulation, there is no way to calculate the probability that the null hypothesis is true, and the effect size (represented by **β** which corresponds to the log(OR)) is a completely separate parameter. Generally **β** is fixed to be 0 under the null, and is then maximized given the data in the alternate model that is tested against the null. P-values speak only to the likelihood of observing your specific data under the null hypothesis.

### **Three ways to compute a p-value**

1. Score test.
2. Wald’s test. This is the default p-value returned by R’s `summary()` function.
3. Likelihood ratio test.

For GWAS, software such as [PLINK](https://www.cog-genomics.org/plink/2.0/) and [SAIGE](https://github.com/weizhouUMICH/SAIGE) efficiently provide multiple tests that can be run across all variants in the genome.

#### Additional Reading

* Matti Pirinen’s [GWAS course notes, Week 2](https://www.mv.helsinki.fi/home/mjxpirin/GWAS_course/material/GWAS2.pdf).
* [Stat Trek](https://stattrek.com/).


# GWAS Meta-analysis

## What is a GWAS meta-analysis?

As explained on the [GWAS Analysis page](/background-reading/gwas-analysis), a Genome-Wide Association Study (GWAS) identifies genetic variants associated with a phenotype within a single study population (like the FinnGen study cohort). Even in very large cohorts, however, there may not be enough statistical power to identify variant associations that have small effect sizes or for rare variants. This is where **GWAS meta-analysis** can be useful.

A GWAS meta-analysis is a statistical technique that combines the results from multiple independent GWAS that have tested the genetic associations of the same phenotype or trait in different cohorts. Rather than combining the raw, individual-level phenotype and genotype data, the resulting summary statistics (primarily the effect size β and its standard error) from each study can be combined for each overlapping genetic variant.

The goal is to increase the total sample size significantly, thereby boosting the statistical power to:

1. Detect novel associations that were too weak to reach genome-wide significance in any single study.
2. More precisely estimate the effect sizes ($$\beta$$) of known variants.

## How does it work?

The core concept of a GWAS meta-analysis is, for each genetic variant, to calculate a weighted average of the effect sizes ($$\beta$$) across all contributing studies. The weighting is crucial:

* Studies with more precise estimates (i.e., those with smaller standard errors, often due to a larger sample size) are given more weight in the final combined result.
* The final output is a new set of summary statistics (combined $$\beta$$, $$\text{SE}$$, and P-value) for every tested variant, representing the evidence across all studies combined.

## **Extending the GWAS model**

### Simple GWAS linear regression model (quantitative phenotypes)

In the simple linear additive GWAS model [described previously](/background-reading/gwas-analysis), we are trying to fitting a "line of best fit" between the phenotype and genotype data. In mathematics terms, we are trying to find the parameters $$\mu$$ and $$\beta$$ that minimize the sum of squared errors $$||\mathbf{\epsilon}||^2$$ for the regression equation $$\mathbf{y} = \mu + \mathbf{x}\beta + \mathbf{\epsilon}$$, where:

* $$\mathbf{y}$$ is a vector of the individual phenotypes $$(y\_1,y\_2,...,y\_M)$$ across all $$M$$ samples
* $$\mathbf{x}$$ is a vector of the individual genotypes $$(x\_1,x\_2,...,x\_M)$$ across all $$M$$ samples, each coded as 0, 1, or 2 which represents the number of copies of the alternate allele an individual has
* $$\mu$$ is the regression intercept (mean value of individuals without the variant, i.e., homozygous for reference allele - those with genotype $$x$$ as 0)
* $$\beta$$ is the regression coefficient (effect size) which captures the average (linear) increase in the phenotype for each copy of the alternate allele
* $$\mathbf{\epsilon}$$ is the vector of error terms, representing deviation away from the line of best fit for each individual, which is hopefully normally distributed.

In recessive GWAS models, the same process is applied but genotypes $$\mathbf{x}$$ are first recoded so that the standard (0, 1, 2) are now coded as (0, 0, 1), so that $$\beta$$ represents the effect on the phenotype of being homozygous for the alternate allele versus not being homozygous for the alternate allele. Similarly, for dominant GWAS models, the genotypes $$\mathbf{x}$$ are recoded from the standard (0, 1, 2) to (0, 1, 1) meaning that the GWAS $$\beta$$ represents the effect on the phenotype of carrying at least one alternate allele versus carrying no alternate alleles.

### Simple GWAS logistic regression model (binary phenotypes)

For binary phenotypes and traits, the model and interpretation of the parameters is a little different, because we are no longer estimating the increase in a trait (per copy of alternate allele), but instead estimating the increase in odds of being a case. The simple logistic GWAS model can be specified as

<p align="center"><span class="math">\log \left(\frac{\text{Pr}(Y = 1 | X = x)}{\text{Pr}(Y=0 | X=x)}\right)= \mu + \mathbf{x}\beta + \mathbf{\epsilon}</span></p>

where $$\log$$ is the[ natural logarithm function](https://en.wikipedia.org/wiki/Natural_logarithm), and $$\text{Pr}(Y=1|X=x)$$ and $$\text{Pr}(Y=0|X=x)$$ represent the respective probabilities that an individual is a case ($$Y=1$$) or control $$(Y=0)$$, given a specific genotype $$x$$. The parameter $$\mu$$ now represents the logarithm of odds ("log-odds") of being a case when carrying no alternate alleles (i.e., genotype $$x=0$$) and $$\beta$$ represents the increase in log-odds of being a case for each copy of the alternate allele.

As an example, if we run a GWAS for a disease, and for a specific variant we find a statistically significant (log-odds) estimate of $$\beta=0.1$$, we can calculate the odds ratio as $$e^{\beta} = e^{0.1} \approx 1.11$$ which can be interpreted as each copy of the alternate allele increasing the odds of having the disease by approximately 11%.

### Meta-analysis: Combining estimates from multiple studies

The model used in a single GWAS yields an effect estimate $$\beta\_i$$ for a study $$i$$. In a meta-analysis, we combine study-specific effect estimates for $$N$$ studies $$(\beta\_1,\beta\_2,...,\beta\_N)$$ into a single overall effect estimate $$\beta\_{meta}$$ and standard error estimate $$\text{SE}\_{meta}$$ using

<p align="center"><span class="math">\beta_{meta} = \frac{\sum_{i=1}^{N} w_i \beta_i}{\sum_{i=1}^{N} w_i}</span> <span class="math">\text{SE}_{meta} = \sqrt{\frac{1}{\sum_{i=1}^{N} w_i}}</span></p>

where $$w\_i$$ is the weight ([explained below](#weighting-scheme)) assigned to study $$i$$ for that variant. In simple terms, the meta-analysis effect size for a variant is calculated as the sum of each study's effect size (for that variant) multiplied by that study's weight for that variant, divided by the sum of that variant's weights across all included studies.

In a similar way to the individual GWAS effect estimates, P-values are found by first calculating the variant's $$Z$$ score as $$Z\_{meta} = \frac{\beta\_{meta}}{\text{SE}\_{meta}}$$ which follows a standard normal distribution. A $$Z$$ test is then performed, which results in a P-value that represents the probability that we would see such an effect estimate (and standard error) by chance, given that the null hypothesis is true of no real phenotype-variant association. Typical genome-wide significance thresholds of P<5x10<sup>-8</sup> (or stricter) can then be applied to find the statistically significant variants. For more information on interpretation of association P-values, see the [P-values page](/background-reading/p-values).

### Fixed-effects versus random effects models

There are various choices for how the weights $$w\_i$$ are calculated, which will have an effect on contribution of each study's effect size estimate to the overall meta-analysis estimate. One important decision that affects the weighting is the choice between using a fixed-effects or random-effects model when using weights that incorporate the variance of a study's effect size estimate (e.g., weights that are calculated using $$\text{SE}$$).

The **fixed-effects (FE) model** assumes there is a single, common true effect size that underlies all studies (i.e., between-study variance, $$\tau^2$$, is negligible). The model assumes that any variation, across the multiple studies, in a variant's effect estimate is due only to random or chance error within each study.

The **random-effects (RE) model** assumes that the true effect size varies from study to study (i.e., $$\tau^2$$ is non-zero) and Instead of a single true effect, there is a distribution of true effects. The model asserts that any observed variation of a variant's effect across different studies is due to both random error and statistical heterogeneity (systematic differences) between studies, such as phenotype definition, GWAS model, ancestry, etc. If there is no between-study heterogeneity, fixed- and random-effects models should provide the same results.

The core assumption of the FE model is that every study is estimating the exact same underlying true effect, an assumption that is rarely fully satisfied in the context of real-world systematic differences between studies. However, RE models, which acknowledge and incorporate true heterogeneity of effects, typically have significantly less statistical power to detect associations than their FE counterparts. This trade-off between power and realism makes FE models the usual choice for GWAS meta-analysis.

### Weighting scheme

When performing meta-analyses, weighting the effect estimates allows individual study estimates to influence the overall estimate based on their precision; studies with more precise estimates have a larger effect on the meta-analysis estimate.The most common weighting schemes for GWAS meta-analysis are inverse-variance weighting and sample size-based weighting.

**Inverse-variance weighting** uses the inverse of the effect estimate variance, with weights $$w\_i$$ calculated as:

<p align="center">Fixed-effect: <span class="math">w_i = \text{SE}_i^{-2} = \frac{1}{\text{SE}_i^2}</span> Random-effect: <span class="math">w_i = (\text{SE}_i^2 + \hat{\tau}^2)^{-1} = \frac{1}{\text{SE}_i^2 + \hat{\tau}^2}</span></p>

where $$\text{SE}\_i$$ is that variant's effect size standard error for study $$i$$ and $$\hat{\tau}^2$$ is the estimated between-study variance. This method ensures that the studies that are more certain of their effect estimate $$\beta$$ (smaller $$\text{SE}$$) have a larger influence on the combined estimate.

**Sample size-based weighting** is much simpler to implement and can be used in cases where the effect size estimate variance ($$\text{SE}^2$$) is not provided, with weights set as the study's sample size $$w\_i = N\_i$$. This weighting scheme, however, makes the assumption that larger sample sizes will lead to more precise results and may give an outsized influence to larger studies on the overall effect estimate, regardless of actual precision.

Other weighting schemes existing such as imputation-quality weighting, where a variant's effect size is weighted by its imputation quality in each study so that effect sizes of better-imputed variants have a stronger influence, or allele-frequency based weighting (sometimes used in rare variant analyses) which can give more weight to estimates from studies where the variant is rarer.

### Heterogeneity statistics

In addition to calculating a combined effect estimates, GWAS meta-analyses typically also provide heterogeneity statistics, which indicate how much a variants' effect size estimates vary between studies. A common choice is the [Cochran's $$Q$$ statistic](https://en.wikipedia.org/wiki/Cochran's_Q_test), which is calculated (for each variant) as

<p align="center"><span class="math">Q = \sum_{i=1}^N w_i (\beta_i - \beta_{meta})^2</span></p>

where $$w\_i$$ and $$\beta\_i$$ are the variant's weight and effect estimate, respective, from study $$i$$ and $$\beta\_{meta}$$ is the variant's effect estimate from the meta-analysis. In simple terms, the squared difference between each study's effect estimate and the meta-analysis is weighted and summed across all studies; the higher the $$Q$$ for a variant, the more variable (heterogeneous) that variant's effects are across the included studies.

The $$Q$$ statistic follows a $$\chi^2$$ distribution with $$N-1$$ degrees of freedom, where $$N$$ is the number of studies, and the associated P-value represents the probability that a $$Q$$ statistic of that size or larger would be seen by chance, given that the null hypothesis that there is no heterogeneity between different studies' effect size estimates.

The statistical power of Cochran's $$Q$$ can be limited as it depends on the number of studies, so some software also calculate an alternative $$I^2$$ statistic, calculated as

<p align="center"><span class="math">I^2 = \frac{Q - (N-1)}{Q} \times 100\%</span></p>

The $$I^2$$ statistic attempts to capture the percentage of the total variation of a variant's effect size across studies that is due to true heterogeneity (differences inherent in the studies) rather than random variation. Values of $$I^2$$ can loosely be interpreted as low (0-30%), moderate (30-50%), substantial (50-80%) and considerable heterogeneity (80-100%).

GWAS effect size estimates will naturally vary across different studies due to many factors, including differences in GWAS models, population ancestries and structures, cohort ascertainment biases, phenotype definitions, sample sizes and the precision of effect estimates themselves. The $$Q$$ statistic (and its P-value) and the $$I^2$$ statistic are important, as they provide an indication of whether the heterogeneity is higher than expected and so whether a particular variant's effect estimates warrant further investigation to find the source of the heterogeneity.

## Key considerations

Meta-analysis relies on the assumption that the studies being combined are homogeneous enough for the results to be comparable.

1. Phenotype definition: The phenotype (e.g., Type 2 Diabetes) must be defined and measured consistently across all studies. Differences in case/control ascertainment can introduce heterogeneity (differences in effect estimates not due to chance).
2. Ancestry: Combining cohorts of different genetic ancestries is common and necessary for generalizability, but it may introduce heterogeneity. Advanced methods can be used to account for this.
3. Statistical models: Most modern GWAS implement more complex linear mixed models (LMMs) than the simple linear regression above, which allows them to better correct for population structure and relatedness and reduce the number of false-positive associations. The above-described meta-analysis approaches are still applicable to effect size estimates produced by these more complex models, but care must be taken to ensure that the effect size $$\beta$$ in each contributing study is estimated using a comparable statistical model.
4. Heterogeneity of effect: Most GWAS meta-analysis software will also provide a heterogeneity statistic and P-value for each variant tested. For genetic variants identified as statistically significant in a meta-analysis, the statistical significance of the variant's heterogeneity statistic should also be considered with those that are significant warranting further investigation.
5. Weighting approach: The appropriate weighting methods (such as inverse-variance weighting) and model (random-effects versus fixed effects) should be selected based on the available data and summary statistics, as well as tests of the underlying model assumptions through assessing effect estimate heterogeneity.

## FinnGen meta-analyses

Starting from data release 12, the FinnGen core team has been performing and releasing results of GWAS meta-analyses of FinnGen, UK Biobank (UKBB) and the Million Veterans Program (MVP) for phenotypes that can be matched between the cohorts. Both two-way FinnGen-UKBB and three-way FinnGen-UKBB-MVP meta-analyses are performed for each release.

Meta-analyses are performed using FinnGen's own [in-house meta-analysis workflow](https://github.com/FINNGEN/META_ANALYSIS), which is designed for Google's cloud-based computing environment, using a fixed-effects inverse-variance weighting scheme. More details on quality control, phenotype matching between studies and locations of results files can be found at the [Meta-analyses page](/finngen-data-specifics/green-library-data-aggregate-data/other-analyses-available/meta-analyses). Results can also be viewed at the relevant PheWeb browsers: [FinnGen-UKBB](https://metaresults-ukbb.finngen.fi/) and [FinnGen-UKBB-MVP](https://mvp-ukbb.finngen.fi/).

## GWAS meta-analysis software

There are a number of software packages available to perform meta-analysis. The most common include:

* [METAL](http://csg.sph.umich.edu/abecasis/Metal/download/) - old but popular, quick and easy to install and use, limited to fixed effects models but can perform inverse-variance and sample-size weighting, efficient for large datasets but limited features, random effects forked version [also available](https://github.com/explodecomputer/random-metal)
* [GWAMA](https://genomics.ut.ee/en/tools) - can run fixed and random effects models, with additional tools for QC and visualisation of results
* [PLINK](https://www.cog-genomics.org/plink/1.9/) - less commonly used for meta-analysis but is easy to use, can run fixed and random effects models and has good QC features implemented
* [mtag](https://github.com/JonJala/mtag) - typically used for jointly analyzing multiple traits, but can also perform (non trans-ancestry) meta-analysis, the python-based [mama](https://github.com/JonJala/mama) extends the mtag framework to handle trans-ancestry meta-analyses
* [rmeta R package](https://cran.r-project.org/web/packages/rmeta/index.html) - convenient if meta-analysis within the R environment is preferred
* [FINNGEN/META\_ANALYSIS](https://github.com/FINNGEN/META_ANALYSIS) - FinnGen's own meta-analysis pipeline for use in the Google Cloud environment

## Additional reading

* [**Genome-wide Association Studies**, Uffelmann et al. (2021), *Nature Reviews Methods Primers*](https://doi.org/10.1038/s43586-021-00056-9)
* [**Meta-Analysis in Genome-Wide Association Studies**, Zeggini & Ioannidis (2009), *Pharmacogenomics*](https://doi.org/10.2217/14622416.10.2.191)
* [**Random-Effects Model Aimed at Discovering Associations in Meta-Analysis of Genome-wide Association Studies**, Han & Eskin (2011), *AJHG*](https://doi.org/10.1016/j.ajhg.2011.04.014)
* Material from Matti Pirinen's GWAS course, part of the Life Science Informatics MSc programme at the University of Helsinki:
  * [GWAS 1: What is a GWAS?](https://www.mv.helsinki.fi/home/mjxpirin/GWAS_course/material/GWAS1.pdf)
  * [GWAS 8: Heritability and mixed models](https://www.mv.helsinki.fi/home/mjxpirin/GWAS_course/material/GWAS8.pdf)
  * [GWAS 9: Meta-analysis and summary statistics](https://www.mv.helsinki.fi/home/mjxpirin/GWAS_course/material/GWAS9.pdf)


# Heritability and genetic correlations

## Heritability

[Heritability ](https://www.nature.com/articles/nrg2322)measures the proportion of variance of the phenotype that is due to genetic differences between individuals. Heritability is always a property of a particular population, and its value can vary between different environmental conditions as the relative roles of genes and environment change.

#### Phenotypic correlations

Heritabilities have been estimated for a long time using phenotypic correlations between relatives of different degrees. For example, the traditional twin estimates compare phenotypic similarity in monozygotic twin pairs to similarity in dizygotic twin pairs. Under some strong assumptions (such as that the environmental contribution to the phenotypic similarity would be the same for a monozygotic as for a dizygotic twin pair, and that the genetic effects act additively over loci) it follows that the difference between the correlation estimates of these two types of twin pairs leads to an estimate of heritability

In practice, (narrow sense, that is, variance explained by the additive effects of the variants) heritability $$h^2$$ \_\_ can be estimated by comparing individual phenotypic variation among related individuals in a population, by examining the association between individual phenotype and genotype data, or by modelling summary-level data from genome-wide association studies (GWAS).

#### Ldsc software

In FinnGen, [ldsc](https://github.com/bulik/ldsc) software has been used to estimate heritabilities for all endpoints from the released summary statistics using both Finnish and European LD panel.

These **heritability estimates** can be found from:

`/finngen/library-green/finngen_R8_analysis_data/ldsc/finngen_R`*`(data freeze specific)`*`_[FIN/EUR].ldsc.heritability.tsv`,

and the documentation for the files can be found [here.](/finngen-data-specifics/green-library-data-aggregate-data/core-analysis-results-files/heritabilities)

## Genetic correlation

A genetic correlation ($$r\_g$$) between two traits is the proportion of variance that the two traits share due to genetic causes. A genetic correlation of 0 implies that the genetic effects on one trait are are independent of the other, while genetic correlation of 1 implies that all of the genetic influences on the two traits are identical. In practise, genetic correlations between two traits can be computed from the GWAS summary statistics by computing the correlation of the regression coefficients.

In FinnGen, [ldsc](https://github.com/bulik/ldsc) software has been used to estimate genetic correlations for all endpoint pairs from the released summary statistics using both Finnish and European LD panel.

All these **pairwise genetic correlations** can be found from:

`/finngen/library-green/finngen_R<ver>/finngen_R<ver>_analysis_data/ldsc/data/finngen_R<ver>_FIN.ldsc.summary.tsv`

and the documentation for the files can be found [here](/finngen-data-specifics/green-library-data-aggregate-data/core-analysis-results-files/pairwise-endpoint-genetic-correlation-format).

#### For more information:

please see this [github page](https://github.com/Nealelab/ldsc/wiki/Heritability-and-Genetic-Correlation).


# Finemapping

Often at a region of genetic association with phenotype, there will be many variants that are statistically significant. Although, sometimes there are instances where one coding SNP is the only variant at the locus, these are quite rare overall.

Finemapping takes all the variants that are significant at a locus and assigns a probability that each is the causal variant. Any variants that are assigned a non-zero probability are then part of a "*credible set*", this credible set is displayed in PheWeb (refer to [**Additional Reading**](#additional-reading)) and is also used in calculating colocalization.

<figure><img src="https://3072695768-files.gitbook.io/~/files/v0/b/gitbook-x-prod.appspot.com/o/spaces%2F-MhYL0UTLjqsuIdK0SSO%2Fuploads%2Fgit-blob-39072a3d45a4a609b80d59a12e279090590cf858%2Fkuva%20(83).png?alt=media" alt=""><figcaption></figcaption></figure>

#### Additional Reading:

* [Finemapping methods used in FinnGen](https://finngen.gitbook.io/documentation/methods/finemapping) : from the FinnGen Release notes for R5, but same methods currently in use
* [Finemapping results format ](/finngen-data-specifics/green-library-data-aggregate-data/core-analysis-results-files/finemapping-results-format)in FinnGen
* [How to access Finemapping data in FinnGen](https://www.finngen.fi/en/members/recordings/finngen-data-users-meeting-23rd-feb-2021) : by Mark Daly, Users' meeting tutorial
* [Slides on the statistical background of Finemapping](https://www.mv.helsinki.fi/home/mjxpirin/GWAS_course/material/GWAS7_slides.pdf) : From Matti Pirinen's GWAS course, start at Slide 21 for Finemapping.
* [Detailed notes on finemapping from Matti Pirinen's GWAS course](https://www.mv.helsinki.fi/home/mjxpirin/GWAS_course/material/GWAS7.pdf) (page 23 starts Finemapping)
* [Updates on FineMapping from Masa Kanai](https://www.finngen.fi/en/members/recordings/finngen-data-users-meeting-22th-september-2020): in this Users' meeting tutorial, Masa describes some of the challenges in trans-ethnic finemapping and the filtering and processing updates that will become part of FinnGen


# Conditional analysis

In addition to fine-mapping, a more robust way is to use **stepwise forward selection** (also called **iterative conditioning**, or **conditional analysis**) to build iteratively a set *S* of SNPSs based on an initial "seed" variant, it usually being the lead variant (lowest pval) of a certain region. The next step is to perform a regular analysis where now variants in *S* are treated as covariates. If the new lead variant is significant, it's added to *S* and the analysis is repeated as long as lead variants remain within significance. This approach was made popular by [GCTA](https://cnsgenomics.com/software/gcta/#Overview)’s Conditional & joint (COJO) analysis of GWAS results.\
\
The algorithm works as follows:

```
initially S is empty
repeat until all P-values outside S are > threshold
  add SNP with the lowest P-value to S
  update P-values of all SNPs 'l' outside S using joint model Y ~ X.S + X.l
end repeat
```


# Colocalization

A "*credible set*" is the set of variant(s) at a locus that is most statistically likely to contain the causal variant by [finemapping](/background-reading/finemapping) methods.

What colocalization does is to ask if association signals overlap not just at one SNP but for the whole credible set that was finemapped. If the credible set of an eQTL for a gene overlaps well the credible set of a genetic association, that can be one clue to the underlying gene which could be associated with the trait that you are studying.

<figure><img src="https://3072695768-files.gitbook.io/~/files/v0/b/gitbook-x-prod.appspot.com/o/spaces%2F-MhYL0UTLjqsuIdK0SSO%2Fuploads%2Fgit-blob-db722b131309b79f08bf635ec747151a9a984948%2Fkuva%20(29).png?alt=media" alt=""><figcaption></figcaption></figure>

[Click here to read more about how colocalization is done in FinnGen](/finngen-data-specifics/green-library-data-aggregate-data/other-analyses-available/colocalizations) and [click here to read more about the file format of the FInnGen colocalization results](/finngen-data-specifics/green-library-data-aggregate-data/core-analysis-results-files/colocalization-results-format).


# Using Polygenic Risk Scores

Large-scale genetic association studies comparing disease cases with controls have identified thousands of genetic loci associated with various diseases. Studies have been done for traits such as height, lipid levels, and educational attainment. Individually, the detected loci typically modify the disease risks only minimally, but their cumulative impact across the genome can be considerable.

### Polygenic risk scores (PRSs)

Polygenic risk scores (PRSs) measure this cumulative genetic burden, and their effect on risk stratification and risk prediction has been shown for many diseases and traits.

Several approaches exist for developing PRS. The most simple methods to sum linearly the contribution of each regional peak, only focusing on low p-values. Newer methods use a more sophisticated approach that takes into account the whole genomic structure ([linkage disequilibrium](/background-reading/linkage-disequilibrium-ld)) and assigns a weight to each variant, increasing the weight of the most significant contributions and reducing the weight of irrelevant and statistically correlated signals to 0 (Figure 1). Once such weights have been calculated, one can proceed to sum all weights over the genome of the target population. Details on the statistical modeling underlying PRS generation can be found in [Matti Pirinen’s GWAS course in topic 9 (‘Meta-analysis and summary statistics’)](https://www.mv.helsinki.fi/home/mjxpirin/GWAS_course/).

![](https://lh6.googleusercontent.com/L_gSAbHittE8m6OSkxONpC8o5QmVQmiL_p2XBaiij1r3ZEBtgqh7mGUNHvSCToIim-fg9bkDtDrDy7HRoqpETzoKZCJ4P1GgFM-o0neZ10MHVwvV-Eai6xAB8HGOtNTbDypUdXDk)

**Figure 1: General principle of newer methods used for building PRS**

### PRS

Ultimately, **all PRS algorithms produce**, for each individual, **a score** that is meaningless by itself, but that allows us to rank the individuals in terms of relative risk to each other. **Common ways to present PRS effects** include:

* **scaling the PRS to mean zero and a standard deviation of one**, which allows one to show effect sizes by one standard deviation increase in the PRS. Also with this, the individuals’ PRS values can be interpreted in a similar way as for instance growth charts familiar to clinicians, and we can, for instance, say that “an individual has a PRS of +2.0SD”.
* **categorizing individuals into groups** based on levels of PRS. No widely accepted categories exist, but some commonly used categories include quintiles or a comparison between individuals above the 90th percentile vs the rest of the distribution.

A reporting framework for PRS studies can be found at: [Wand, H., Lambert, S.A., Tamburro, C. et al. Improving reporting standards for polygenic scores in risk prediction studies. Nature 591, 211–219 (2021). https://doi.org/10.1038/s41586-021-03243-6d](https://www.nature.com/articles/s41586-021-03243-6)

#### PRS use cases

By summarizing common genetic effects across the genome, we capture germline genetic susceptibility to disease into a single measure, the PRS. The PRS can be used for several types of analyses, from understanding biological processes underlying diseases, to estimating their potential role as clinical tools for risk stratification and targeting individuals for risk mitigation. Examples of PRS use cases can be found from [PRS studies using FinnGen data](https://www.finngen.fi/en/publications).

### FinnGen PRS's

With improved and larger GWAS, PRS computations will continue to improve. Moreover, the methodologies used for generating PRS are constantly improving. An important limitation of PRS is that the majority of the research has been performed in individuals of European ancestry ([Martin, A.R., Kanai, M., Kamatani, Y. et al. Clinical use of current polygenic risk scores may exacerbate health disparities. Nat Genet 51, 584–591 (2019)](https://doi.org/10.1038/s41588-019-0379-x)), and an important goal for the field is to improve the diversity of PRS studies, including the development of methods that allow PRS modeling in individuals of admixed ancestry.

In FinnGen, we provide a large number of PRS already calculated for the community and are ready for use. Custom PRS for diseases and traits of interest can also be generated with the [FinnGen PRS pipeline in the Sandbox environment](/working-in-the-sandbox/running-analyses-in-sandbox/how-to-run-prs). The current method used by FinnGen for generating PRS is: [T Ge, CY Chen, Y Ni, YCA Feng, JW Smoller. Polygenic Prediction via Bayesian Regression and Continuous Shrinkage Priors. Nature Communications, 10:1776, 2019](https://pubmed.ncbi.nlm.nih.gov/30992449/).

#### Additional reading:

* [Timpson, N., Greenwood, C., Soranzo, N. et al. Genetic architecture: the shape of the genetic contribution to human traits and disease. Nat Rev Genet 19, 110–124 (2018)](https://doi.org/10.1038/nrg.2017.101). \[A review describing the concept of genetic architecture, which is relevant for understanding and applying PRSs.]
* [Chatterjee, N., Shi, J. & García-Closas, M. Developing and evaluating polygenic risk prediction models for stratified disease prevention. Nat Rev Genet 17, 392–406 (2016)](https://doi.org/10.1038/nrg.2016.27). \[A summary of the methodologies used for building, evaluating and applying risk prediction models that include information from genetic testing and environmental risk factors. New methods for building PRSs have been developed after this article was published, but the review is a great summary of general methodology and terminology used in PRS studies.]
* [Torkamani, A., Wineinger, N. E. & Topol, E. The personal and clinical utility of polygenic risk scores](https://doi.org/10.1038/s41576-018-0018-x). Nat. Rev. Genet. 19, 581–590 (2018). \[This review lays out the principles of PRS for clinical risk stratification in common diseases.]

[Click here to read more how you can run PRS using FinnGen data](/working-in-the-sandbox/running-analyses-in-sandbox/how-to-run-prs)\\


# PheWAS analysis

### Difference between PheWAS and GWAS

The difference between PheWAS (Phenome-wide association studies) and GWAS is the **direction of inference.**

In **GWAS**, we look at all **variants’ effect on one phenotype**, whereas a **PheWAS** looks at one **variant’s effect** **on numerous phenotypes**.


# Survival analysis


# Longitudinal Data Analysis

One of the big advantages of the FinnGen project is that it **contains data over an individual’s whole lifetime**. This is quite different from the information that might be collected for a particular phenotypic study.

Because this type of deep longitudinal data is unprecedented there are few available tools in the community that are able to maximize the full extent of the data.

FinnGen has been working to develop tools that enable you to make use of this deep data.

### OHDSI ATLAS tool

One tool we have installed is the [OHDSI ATLAS](https://www.ohdsi.org/atlas-a-unified-interface-for-the-ohdsi-tools/) tool that gives you a graphical view of a medically defined cohort. This is available in the Sandbox under `Applications > FinnGen > Atlas`(Figure below).

![Where is ATLAS on the Sandbox?](https://3072695768-files.gitbook.io/~/files/v0/b/gitbook-x-prod.appspot.com/o/spaces%2F-MhYL0UTLjqsuIdK0SSO%2Fuploads%2Fgit-blob-571d18a87136c2239279daf0e022c9e32d793aad%2FScreen%20Shot%202021-09-10%20at%205.35.37%20PM.png?alt=media)

OHDSI provides a [Common Data Model (CDM) ](https://www.ohdsi.org/data-standardization/the-common-data-model/)within a relational database that other tools can connect to.

[Trajectory Visualization Tool](/working-in-the-sandbox/which-tools-are-available/trajectory-visualization-tool-tvt/trajectory-visualization-tool-tvt) (TVT) is one tool built on the CDM that will enable you to view medical codes over an individual’s life trajectory.

#### Additional reading:

If you are interested in looking more at trajectory analysis in the literature, in addition to reading the [OHDSI available tools](https://ohdsi.org/software-tools/), you might also look at the work of Søren Brunak.

* [Søren Brunak](https://www.cpr.ku.dk/research/disease-systems-biology/brunak/) has been working at these types of questions in the Danish health registries e.g. [Danish disease trajectory browser](https://pubmed.ncbi.nlm.nih.gov/33009368/)


# GWAS Association to Biological Function

Understanding how to take a GWAS association to a biological understanding can be a complex process. To most of us, this tends to be a bit more of a combination of crafting instincts from available facts than a science.

Now that you have potentially identified a handful of variants of interest (Figure below), what do you do now? You may have to then run additional experiments and fine tune your variant to a gene or biological function. [Eddie from Gosia Tryka's group wrote a wonderful review](https://www.frontiersin.org/articles/10.3389/fgene.2020.00424/full) where the figure below is adapted from.

![Adapted from Cano-Gamez and Gosia Trynka (2020) Frontiers in Genetics](https://3072695768-files.gitbook.io/~/files/v0/b/gitbook-x-prod.appspot.com/o/spaces%2F-MhYL0UTLjqsuIdK0SSO%2Fuploads%2Fgit-blob-e7c7a77ef7e510167207ca033f7e7f16bd33babb%2Fimage%20\(108\).png?alt=media)

One of our FinnGen partners, [Eric Fauman](https://twitter.com/eric_fauman?lang=en), has [Tweetorials](https://twitter.com/Eric_Fauman/status/1659633257166565376) on frequent examples of how you might explore which is the causal gene from a GWAS. We encourage you to check it out for some examples.

*Note: You need to have an X account to view X (formerly known as Twitter).*


# Genetic Data Resources outside FinnGen

The FinnGen Analysis team incorporates into [PheWeb](https://results.finngen.fi) genetic overlaps with published GWAS data in [GWAS Catalog](https://www.ebi.ac.uk/gwas/) and [ClinVar](https://www.ncbi.nlm.nih.gov/clinvar/). However, there are a number of other places you might use to explore your data.

### **How to view allele frequencies - gnomAD**

For viewing worldwide allele frequencies and looking at measures of severity of a particular variant, [gnomAD](https://gnomad.broadinstitute.org/) is the best option. There are different reference genomes available there, but if you search using the variant ID that begins “*rs*” then you will not have to consider which reference sequence you have (FinnGen genotypes are referenced to the [GRCh 38](https://www.ncbi.nlm.nih.gov/assembly/GCF_000001405.26/) of the human genome; [gnomAD](https://gnomad.broadinstitute.org) v3.1.1).

### Where is the gene expressed in - GTEx

To understand which organ systems your gene is expressed in and if the variant you are interested in causes and gene-specific expression regulation you can find that in [GTEx](https://gtexportal.org/home/). In GTEx you can explore expression quantitative trait loci (eQTLs, i.e. genetic variants that explain variance in mRNA expression levels). If you are interested in protein-level expression you can visit [The Human Protein Atlas](https://www.proteinatlas.org/).

### Public resources - OpenTargets

For a complete view of the public resources about the genetics of a variant or gene, you can visit the [OpenTargets ](https://genetics.opentargets.org/)(be careful to select "*OpenTargets **Genetics*****"** as your search engine term, as there have another site which is not as useful).

### Publications - PubMed

Of course, when discovering a new association and looking for what biology is known, it is always good to search [PubMed](https://pubmed.ncbi.nlm.nih.gov/). Keep in mind that FinnGen uses the canonical reference name for the gene but genes often have many aliases, especially in older literature. [Gene Cards](https://www.genecards.org/) is one easy place you can look up all the aliases for a gene. Often Googling your variant/gene or searching it on Twitter can also provide recent and interesting results.


# Getting Started with Unix

### Unix as an operating system

Many applications in bioinformatics and statistical genetics incorporate the use of Unix. The use of Unix as an operating system is important for a few reasons such as

* Ease of **building** efficient **pipelines** for your work i.e. awk, bash, piping
* Ease of **software installation** and **development**
* **Multiple** **versions of a tool** can be installed by the user, just in case an analysis requires an older version of the tool
* Many good **scientific tools** (i.e. aligners, samtools) which allow for flexibility in analysis is written in a non-portable way for Unix
* **Text editing/viewing tools** (i.e. sort, cut, paste) are memory efficient
* Large file sizes are handled in a relatively **more efficient** way compared to Mac OS or Windows.

### Recommended courses to learn about Unix

Therefore, the base of the Sandbox is a Unix operating system. The terminal application in the Sandbox is the most basic operator for the Sandbox. There are many courses out there that can allow efficient learning of Unix as a programming tool and operating system. One that we recommend is by Coursera:

* Basic Unix: <https://www.coursera.org/projects/command-line-linux>
* Primer and application to Unix: <https://www.coursera.org/learn/unix>

[Click here to read more about Unix tools that you can use in Sandbox](/working-in-the-sandbox/which-tools-are-available/unix-tools)

Click here to see examples on [how to unzip files in the command line](/faq/about-sandbox/how-to-unzip-files-in-the-command-line)


# Getting Started with R

### What R is used for

The programming language R and its graphical interface RStudio are commonly used for statistics and data analysis. FinnGen installs the freely available versions of these tools in the Sandbox. FinnGen does not provide help debugging R scripts.

### Ways to learn R

You should learn and develop R scripts on your own personal machine, not in the Sandbox. You can download [R](https://www.r-project.org/) and [RStudio](https://www.rstudio.com/products/rstudio/download/) to your own personal computer for this purpose. Often one uses mock or fake data on your personal computer to develop basic scripts and then upload these scripts to the Sandbox.

#### Free online courses

* [EdX](https://www.edx.org/professional-certificate/harvardx-data-science) taught by Harvard biostats professor Rafael Irizarry (Although you can pay for the certificate, the modules are each free)
* [datacamp](https://www.datacamp.com/) (The first sessions “Introduction for R” are free, but more advanced courses have a monthly subscription fee.)
* [Swirl](https://swirlstats.com/)
* [Coursera](https://www.coursera.org/specializations/data-science-foundations-r) (choose R programming)

#### Free online R books

* [R for Data Science](https://r4ds.had.co.nz/), (O'Reilly book)
* [Introduction to Data Science](https://rafalab.github.io/dsbook/) by Rafael Irizarry
* [GWAS analysis in R](https://www.mv.helsinki.fi/home/mjxpirin/GWAS_course/) by FiMM's Matti Pirinen

R is best used with the addition of packages and libraries to suit your specific needs. The vast majority of these are free and open source. For a basic group of packages that cover file, string, and data manipulation, along with improved data visualization, many people use [the Tidyverse.](https://www.tidyverse.org/)

Many basic libraries and packages are already installed on the Sandbox and you can see the full list of these within RStudio. If you want additional packages you can send an email to <humgen-servicedesk@helsinki.fi>.

#### For those with University of Helsinki affiliation these classes are also available:

* Basics of Statistics and R I and II, MAT21001 and MAT21002 (Online or in-person)
* Genome-wide Association Studies, LSI34002 (Matti Pirinen).(Notes for this class include many examples in R and are freely available **-**[ **here**](https://www.mv.helsinki.fi/home/mjxpirin/GWAS_course/)**. )**

[Click here to read more about R libraries in Sandbox](/working-in-the-sandbox/which-tools-are-available/r-libraries)


# Structure of the FinnGen project

**FinnGen** is a collaborative, pre-competitive, public-private **research project** that aims **to** **understand human diseases using genomic data** combined with the rich Finnish health registry data.

The FinnGen research project has produced genome variant **data of** >500,000 Finnish individuals, which is **almost 10% of the entire Finnish population**.

![Why Finland?](https://3072695768-files.gitbook.io/~/files/v0/b/gitbook-x-prod.appspot.com/o/spaces%2F-MhYL0UTLjqsuIdK0SSO%2Fuploads%2Fgit-blob-6b7038d9ed003f0c8f764a2ba024a6ebe3962a35%2FScreen%20Shot%202021-09-16%20at%2011.31.01%20AM.png?alt=media\&token=e11ab95d-cbf4-4465-91bd-59b0fe8a3966)

## **FinnGen Partners**

FinnGen is a partnership between

* Finnish universities
* research institutes
* biobanks
* wellbeing services counties
* several international pharmaceutical companies

The University of Helsinki is the legal entity responsible for the study. All current FinnGen Partners are listed [here](https://www.finngen.fi/en/partners).

## **Governance of FinnGen**

The overall governance of FinnGen is described [here](https://www.finngen.fi/en/governance).

The Steering Committee and the Scientific Committee oversee the FinnGen study.

* **Steering Committee (highest decision-making body)**
* **University of Helsinki (legal entity responsible for the study)**

Both committees have representatives from the University of Helsinki, each biobank, and each pharma partner.

* **University of Helsinki** (specifically, FIMM) **coordinates the FinnGen study**

![](https://3072695768-files.gitbook.io/~/files/v0/b/gitbook-x-prod.appspot.com/o/spaces%2F-MhYL0UTLjqsuIdK0SSO%2Fuploads%2Fgit-blob-c62f998c428b7b9d7ced388bc2e83b690d5b53db%2Fimage%20\(746\).png?alt=media)

### **Steering Committee**

The University of Helsinki, biobanks, pharma partners, Business Finland, and FinBB each have the right to appoint one representative to the FinnGen Steering Committee. The responsibilities of the Steering Committee include major strategic decisions and monitoring the progress of the project against the deliverables, milestones and high-level objectives of the Scientific Plan.

### **Scientific Director**

[Professor Aarno Palotie](https://researchportal.helsinki.fi/en/persons/aarno-palotie) (University of Helsinki) has been appointed as the Scientific Director of the study, and is responsible for the overall conduct and output of the Scientific Plan.

### **The Scientific Committee**

Establishes and oversees the various working groups within the project and advises the Scientific Director. The Scientific Committee is composed of the Scientific Director, working group leaders and scientific representatives appointed by the University of Helsinki, biobanks, and pharma partners.

### **Project Managers, support and administrative support**

Dr. Mervi Aavikko, Dr. Helen Cooper and Denise Öller MSc (Econ), BSc (Biol) have been appointed as FinnGen co-Project Managers and Dr. Risto Kajanne as the FinnGen Project Coordinator. Dr. Mari Kaunisto is the Communications Director and responsible for the proactive public dissemination of the study.

[Several teams](https://www.finngen.fi/en/working_groups) consisting of close to 40 members have been established to take care of the execution of the study.


# Finnish gene pool and health register data

### Isolated population with bottlenecks

Finland is a well-known example of an isolated population where multiple historical bottleneck events (linguistic isolation, famines, epidemics, etc.) followed by consecutive founder effects have shaped the gene pool of present-day Finns.

![](https://3072695768-files.gitbook.io/~/files/v0/b/gitbook-x-prod.appspot.com/o/spaces%2F-MhYL0UTLjqsuIdK0SSO%2Fuploads%2Fgit-blob-44aac4d1a353f6b09efdc7a20ee9158b41f36749%2FScreen%20Shot%202021-09-16%20at%2011.34.41%20AM.png?alt=media\&token=e5ae62f6-3371-421a-b232-497101303f9c)

### Geopolitical changes affected the genetic landscape

Geopolitical changes in the 16th century led to major migratory movements within Finland in the eastern and northern regions. These resulting settlements, initially founded by small numbers of people, have grown in size over time leading to secondary population bottlenecks.

These historical bottlenecks have affected the genetic landscape of Finland and the frequency profile of variants across the entire genome. This provides an excellent opportunity to discover disease-associated genes, as some of the underlying (and initially rare) causal variants have reached a much higher frequency during these population bottlenecks than anywhere else in the world.

This also means other rare variants that were not present in the bottleneck events are completely depleted in Finland.

### Long-term investment in healthcare

FinnGen capitalizes on Finland’s decades-long investment in Finnish healthcare, health registries, epidemiological research, and biobanks.

![How can FinnGen thrive in Finland?](https://3072695768-files.gitbook.io/~/files/v0/b/gitbook-x-prod.appspot.com/o/spaces%2F-MhYL0UTLjqsuIdK0SSO%2Fuploads%2Fgit-blob-8d960d6609fdb07c4c0dd47feb618f92048d1194%2FScreen%20Shot%202021-09-16%20at%2011.39.29%20AM.png?alt=media)

### Defining multi-dimensional phenotypes from longitudinal registry data

FinnGen utilizes the extensive longitudinal registry data available on all Finns to study the genetic components of human health. The opportunity to define informative and multi-dimensional phenotypes from this data is at the heart of FinnGen, and what makes it unique in the present landscape of genetic studies.

![](https://3072695768-files.gitbook.io/~/files/v0/b/gitbook-x-prod.appspot.com/o/spaces%2F-MhYL0UTLjqsuIdK0SSO%2Fuploads%2Fgit-blob-0077a2d69bd0f20c370b06b69c358b12607a50b6%2FScreen%20Shot%202021-09-16%20at%2011.31.39%20AM.png?alt=media)

Combining data from all these different registries provides opportunities to construct reliable disease endpoints, as well as novel long-term phenotypes of disease progression and therapeutic response.

**This registry data enables us to construct treatment trajectories that are difficult to accomplish in most other parts of the world.**

### Further reading

* [Changes in the fine-scale genetic structure of Finland through the 20th century](https://journals.plos.org/plosgenetics/article?id=10.1371/journal.pgen.1009347)
* [Whole-genome view of the consequences of a population bottleneck using 2926 genome sequences from Finland and United Kingdom](https://www.nature.com/articles/ejhg2016205)
* [Geographic Variation and Bias in the Polygenic Scores of Complex Diseases and Traits in Finland](https://pubmed.ncbi.nlm.nih.gov/31155286/)


# FinnGen Data Specifics

The FinnGen project contains phenotype and genotype data for approximately 520,000 individuals. Sample collection and data releases started in 2017. The main phase of sample collection ended in 2023, at the end of FinnGen2. Data releases and analyses will continue until the end of FinnGen 3 in 2027.

![](https://3072695768-files.gitbook.io/~/files/v0/b/gitbook-x-prod.appspot.com/o/spaces%2F-MhYL0UTLjqsuIdK0SSO%2Fuploads%2FkXPqIr3XFdZSJxjUaO4o%2FFrame%201\(14\).png?alt=media\&token=279e4ac0-b30b-4c02-b9b8-40eecffa1026)

## FinnGen data

FinnGen data is classified into aggregated **"green"** data and individual-level **"red"** data:

* **"green"** **data:** aggregated or otherwise anonymous data that does not relate to only one individual, and from which no individual can be identified. A case count of N ≥ 5 is used as a rule for aggregation to turn individual-level data into anonymous data.
* **"red" data:** sensitive, individual-level health and genetic data that is subject to data protection legislation and registry permits. This data must be handled confidentially according to the rules and restrictions set out by the FinnGen project.

In order to **understand** **FinnGen data**, we have some specifics listed in this section:

* [FinnGen Data Freezes and Releases](/finngen-data-specifics/finngen-data-freezes-and-releases)
* [Analysis proposals](/finngen-data-specifics/about-analysis-proposals)
* [Finnish Health Registries and Medical Coding](/finngen-data-specifics/finnish-health-registers-and-medical-coding)
* [Endpoints](/finngen-data-specifics/endpoints)
* [Biobanks in Finland](/finngen-data-specifics/biobanks-in-finland)
* [Publishing FinnGen Results](/publishing-finngen-results)
* [Red Library Data](/finngen-data-specifics/red-library-data-individual-level-data)
* [Green Library Data (Aggregate Data)](/finngen-data-specifics/green-library-data-aggregate-data)
* [Expansion Area 3 (EA3) studies](/finngen-data-specifics/expansion-area-3-ea3-projects)

For information about the FinnGen project, genotype and phenotype data, watch the [FinnGen security training videos](/working-in-the-sandbox) and visit [Finngen Sandbox tutorial site](https://tutorial.finngen.fi/).


# FinnGen Data Freezes and Releases

During the active sample collection phase (years 2017-2023), the **Data Freeze (DF)** happened twice a year in February and August. At these times, FinnGen produced **Data Release (R)** of updated genotype and phenotype data files to the Sandbox.

During FinnGen 3 (Aug 2023 onwards) the sample size is fixed and Data Releases focus on updating health register data. Three releases are planned: R13 (February 2025), R14 (February 2026), and R15 (February 2027).

### Following data files are released to Sandbox per each Data Freeze/Release

* [Genotype files](/finngen-data-specifics/red-library-data-individual-level-data/genotype-data/types-of-genotype-files-available)
* [Phenotype files](/finngen-data-specifics/red-library-data-individual-level-data/what-phenotype-files-are-available-in-sandbox-1)
* [other registry data files ](/finngen-data-specifics/red-library-data-individual-level-data/what-phenotype-files-are-available-in-sandbox-1/other-registers)(periodically updated and released to Sandbox)
* [Core Analysis Results files ](/finngen-data-specifics/green-library-data-aggregate-data/core-analysis-results-files)(released to FinnGen Production Library Green per each Data Release)

All data and core analysis result releases are announced via the finngen-accounts mailing list and at the [FinnGen Science and Users' ](/user-support)meetings. You can also find the releases in the Handbook [Release notes](/release-notes).

**Note on data availability after release:**

When new genotype and phenotype files are first released, please be aware of the following timeline:

* **Month 1:** The analysis team generates covariate files needed for GWAS. You will not be able to run GWAS until these are ready.
* **Months 1-3:** The register and phenotype teams update all [other register data](/finngen-data-specifics/red-library-data-individual-level-data/what-phenotype-files-are-available-in-sandbox-1/other-registers) (not included in the detailed longitudinal data and endpoints) release them to Sandbox. Most of these are also converted to OMOP format and made available to the various analysis tools in the Sandbox.
* **Month 3:** The analysis team releases a set of so-called core analysis results to the [Google Cloud storage green bucket](/finngen-data-specifics/green-library-data-aggregate-data/how-can-you-download-green-data) (`gs://finngen-production-library-green`). These analyses include, but are not limited to, GWAS summary statistics, fine-mapping, colocalization, and autoreporting results.

**Bottom line:** It takes approximately 2-3 months after the initial release before all data and analysis tools are fully updated.

### FinnGen Data Freezes/Releases

<table data-full-width="true"><thead><tr><th width="134.7109375">Release</th><th width="132.23046875">Total sample size</th><th width="135.97265625">Total samples in core GWAS analyses</th><th width="137.53125">Total endpoints</th><th width="134.9296875">Core endpoints</th><th>Date release to partners</th><th>Results released publicly</th></tr></thead><tbody><tr><td>DF1/R1</td><td>52,295</td><td>-</td><td>-</td><td>-</td><td>-</td><td>-</td></tr><tr><td>DF2/R2</td><td>102,739</td><td>96,499</td><td>1,485</td><td>1,485</td><td>Q4 2018</td><td>Q1 2020</td></tr><tr><td>DF3/R3</td><td>146,630</td><td>135,638</td><td>2,737</td><td>1,801</td><td>Q2 2019</td><td>Q2 2020</td></tr><tr><td>DF4/R4</td><td>183,694</td><td>176,899</td><td>3,452</td><td>2,444</td><td>Q4 2019</td><td>Q4 2020</td></tr><tr><td>DF5/R5</td><td>224,737</td><td>218,792</td><td>3,858</td><td>2,803</td><td>Q2 2020</td><td>Q2 2021</td></tr><tr><td>DF6/R6</td><td>271,341</td><td>260,405</td><td>3,995</td><td>2,861</td><td>Q3 2020</td><td>Q3 2021</td></tr><tr><td>DF7/R7</td><td>321,464</td><td>309,154</td><td>4,149</td><td>3,095</td><td>Q1 2021</td><td>Q1 2022</td></tr><tr><td>DF8/R8</td><td>356,213</td><td>342,499</td><td>4,431</td><td>2,202</td><td>Q3 2021</td><td>Q3 2022</td></tr><tr><td>DF9/R9</td><td>392,649</td><td>377,277</td><td>4,526</td><td>2,272</td><td>Q1 2022</td><td>Q2 2023</td></tr><tr><td>DF10/R10</td><td>430,897</td><td>412,181</td><td>4,519</td><td>2,408</td><td>Q3 2022</td><td>Q4 2023</td></tr><tr><td>DF11/R11</td><td>473,681</td><td>453,733</td><td>4,415</td><td>2,444</td><td>Q1 2023</td><td>Q2 2024</td></tr><tr><td>DF12/R12</td><td>520,210</td><td>500,348</td><td>4,421</td><td>2,469</td><td>Q1 2024</td><td>Q2 2024</td></tr><tr><td>DF14/R13</td><td>519,972</td><td>500,186</td><td>4,662</td><td>2,466</td><td>Q1 2025</td><td>~Q2 2026</td></tr><tr><td>DF14/R14</td><td>TBD</td><td>TBD</td><td>TBD</td><td>TBD</td><td>Q1 2026</td><td>~Q2 2027</td></tr><tr><td>DF15/R15</td><td>TBD</td><td>TBD</td><td>TBD</td><td>TBD</td><td>Q1 2027</td><td>~Q2 2028</td></tr></tbody></table>

\[1] total endpoint definitions \[2] endpoints used for core GWAS and PheWAS.

**Number of individuals with genotypes and phenotypes in FinnGen Data Releases.** Starting from R5 the phenotype data has been filtered by genotyped individuals.


# Analysis proposals

#### In this section, we will share the following:

* [What is a FinnGen analysis proposal and when do I need to submit one?](/finngen-data-specifics/about-analysis-proposals/when-do-i-need-to-submit-an-analysis-proposal)
* [How do I submit an analysis proposal?](/finngen-data-specifics/about-analysis-proposals/how-do-i-submit-an-analysis-proposal)
* [How are analysis proposals handled?](/finngen-data-specifics/about-analysis-proposals/how-are-analysis-proposals-handled)
* [What is a FinnGen bespoke analysis proposal and when do I need to submit one?](/finngen-data-specifics/about-analysis-proposals/what-is-a-finngen-bespoke-analysis-proposal-and-when-do-i-need-to-submit-one)
* [How do I submit a bespoke analysis proposal?](/finngen-data-specifics/about-analysis-proposals/how-do-i-submit-a-bespoke-analysis-proposal)
* [How are bespoke analysis proposals handled?](/finngen-data-specifics/about-analysis-proposals/how-are-bespoke-analysis-proposals-handled)
* [What is the difference between FinnGen analysis proposals and FinnGen bespoke analyses?](/finngen-data-specifics/about-analysis-proposals/what-is-the-difference-between-finngen-analysis-proposals-and-finngen-bespoke-analyses)
* [Existing analysis proposals](/finngen-data-specifics/about-analysis-proposals/existing-analysis-proposals)


# What is a FinnGen analysis proposal and when do I need to submit one?

### Proof of scientific purpose

All research done in FinnGen must adhere to the [FinnGen Scientific Plan](https://www.finngen.fi/en/members/document/218) and its amendments ([FinnGen 2 Scientific Plan](https://www.finngen.fi/en/members/document/217) and [FinnGen 3 Scientific Plan](https://www.finngen.fi/en/members/document/1354)) as use of FinnGen data is allowed only for research established in its Scientific Plan. All analyses done using FinnGen data must have a specific articulated scientific purpose, and the potential to produce publishable results.

### Familiarize yourself with the scientific Plan

Please familiarize yourself with the [FinnGen Scientific Plan](https://www.finngen.fi/en/members/document/218) and its amendments ([FinnGen 2 Scientific Plan](https://www.finngen.fi/en/members/document/217) and [FinnGen 3 Scientific Plan](https://www.finngen.fi/en/members/document/1354)) before you start working with FinnGen data.

### Submit a proposal

In order for the FinnGen Scientific Director and the FinnGen Admin team to check that your analysis fits with the FinnGen Scientific Plan and that there are no overlapping efforts ongoing in FinnGen, you must submit a [FinnGen analysis proposal](/finngen-data-specifics/about-analysis-proposals/how-do-i-submit-an-analysis-proposal).

### Reasons for a proposal

The [FinnGen analysis proposal](/finngen-data-specifics/about-analysis-proposals/how-do-i-submit-an-analysis-proposal) must be filled in for any new study aiming to:

* **publishing** FinnGen results
* **sharing** of **non-public** FinnGen **results** with investigators outside of FinnGen
* **downloading** FinnGen results from Sandbox
* **requesting support** **from** FinnGen teams
* **explore** FinnGen **data** in Sandbox

None of the above-mentioned items can be pursued without an approved Analysis Proposal.

### Existing proposals

Existing analysis proposals can be seen [here](https://www.appsheet.com/start/ea608933-2713-4eec-a08e-b06703fb0ea1). Please note that you need to be logged into the system with your finngen-account to view the proposals.


# How do I submit an analysis proposal?

The link to fill in the analysis proposal is available [here](https://docs.google.com/forms/d/e/1FAIpQLSc0J0bpEWB_xvbsf7GAWML0Uhk_5DDCgyUCg20lDi-E4z6wWQ/viewform) and under tools and resources in the finngen.fi [members area](https://www.finngen.fi/en/user/login).

### Before filling in the proposal

**Before you fill in the** [**analysis proposal form**](https://docs.google.com/forms/d/e/1FAIpQLSc0J0bpEWB_xvbsf7GAWML0Uhk_5DDCgyUCg20lDi-E4z6wWQ/viewform)**, review the existing** [**FinnGen analysis proposals**](https://www.appsheet.com/start/ea608933-2713-4eec-a08e-b06703fb0ea1) for possible overlapping proposals! Please note that the you can only access the analysis proposals form and the list of analysis proposals with your finngen account.

In case yours is identical/similar to an already approved proposal, you are encouraged to be in contact with the key investigator for collaboration.

For any questions or concerns, please contact: [finngen-admin@helsinki.fi](file://ad.helsinki.fi/home/m/maavikko/Desktop/finngen-admin@helsinki.fi)


# How are analysis proposals handled?

All analysis **proposals are reviewed by the FinnGen Scientific Director and FinnGen admintration team**. The proposal is checked that it is in line with the overall [FinnGen Scientific Plan](https://www.finngen.fi/en/members/document/218) and its amendments ([FinnGen 2 Scientific Plan](https://www.finngen.fi/en/members/document/217) and [FinnGen 3 Scientific Plan](https://www.finngen.fi/en/members/document/1354)) and any biobank and registry permission granted to FinnGen and that there are no overlap with other proposals. You may be asked to provide additional information on the proposal.

### Analysis proposals procedure

#### **Proposals are evaluated by the FinnGen Scientific Director and the FinnGen administration team**

The evaluators decide is the proposal approved and may request clarifications or amendments to the proposal before the decision. Some of the proposers are invited to present the proposal in one of the upcoming FinnGen meetings. The FinnGen administration team will contact the proposer if the presentation is required.

#### **Approval of the proposal**

The FinnGen administration team will inform the proposer (key investigator in the proposal) about the approval. Usually this process takes 1-3 weeks.

We try to encourage collaboration and thus try to connect researchers that are planning to analyze similar or overlapping topics. All analysis proposals are accessible [here](https://www.appsheet.com/start/ea608933-2713-4eec-a08e-b06703fb0ea1).

#### **After the approval**

After the approval, you will receive an analysis proposal index (F\_YYYY\_NNN), which may be asked from you when you are in contact with FinnGen staff for services. You are also asked the index when requesting to download results out from Sandbox. You can check your proposal index from [here](https://www.appsheet.com/start/ea608933-2713-4eec-a08e-b06703fb0ea1).

Once your analysis proposal has been approved, we (FinnGen) will follow up your progress regularly. Your final results should be shared with all FinnGen Partners. Also your manuscript needs to be circulated to the FinnGen Scientific Committee for comments. It is good to reserve minimum of 3 weeks to get feedback from the FinnGen Partners. Read more how to prepare your manuscript [here](/publishing-finngen-results).

So once you have your results ready, please be in contact <finngen-admin@helsinki.fi> for more guidance.


# What is a FinnGen bespoke analysis proposal and when do I need to submit one?

All research done in FinnGen must adhere to the [FinnGen Scientific Plan](https://www.finngen.fi/en/members/document/218) and its amendments ([FinnGen 2 Scientific Plan](https://www.finngen.fi/en/members/document/217) and [FinnGen 3 Scientific Plan](https://www.finngen.fi/en/members/document/1354)) as use of FinnGen data is allowed only for research established in its Scientific Plan.

All analyses done using FinnGen data must have a specific articulated scientific purpose, and the potential to produce publishable results.

### Before submitting the FinnGen bespoke analysis

Please familiarize yourself with the [FinnGen Scientific Plan](https://www.finngen.fi/en/members/document/218) and its amendments ([FinnGen 2 Scientific Plan](https://www.finngen.fi/en/members/document/217) and [FinnGen 3 Scientific Plan](https://www.finngen.fi/en/members/document/1354))[, ](https://www.finngen.fi/en/members/document/217)as well as [FinnGen bespoke analysis protocol](https://tt.eduuni.fi/sites/hy-finngen/All/Shared%20Documents/Bespoke%20analyses/Protocol%20Bespoke%20Analyses_V4.1_07072020.pdf) before you consider submitting FinnGen bespoke analysis proposal.

### **What is a FinnGen bespoke analyses and when is it used**

FinnGen bespoke analyses are analyses where one or several FinnGen Partners want to conduct analyses using FinnGen data, but without participation of all the other FinnGen Partners and wishes not to share the analysis idea and results to all the other FinnGen Partners. Bespoke analyses are not part of Analysis Group work. FinnGen encourages open collaboration and bespoke analysis to be used only in situations where the results cannot be shared with other FinnGen Partners. Thus far, FinnGen has only a handful of ongoing bespoke analyses.

### Data controllers

Compared to [FinnGen analysis proposals ](/finngen-data-specifics/about-analysis-proposals/when-do-i-need-to-submit-an-analysis-proposal)there is also another difference which is related to the data controller. In the case of [FinnGen analysis proposals ](/finngen-data-specifics/about-analysis-proposals/when-do-i-need-to-submit-an-analysis-proposal)the data controller is the University of Helsinki. This means that the University of Helsinki determines the purpose and means to use the data. In FinnGen bespoke analysis the data controllers are your organization and University of Helsinki jointly. In FinnGen bespoke analysis the joint controllers together determine the purpose and means to use the data. Make sure that a separate joint controllership agreement is concluded between your organization and University of Helsinki before performing the designated bespoke analysis.


# How do I submit a bespoke analysis proposal?

Use [this link](https://elomake.helsinki.fi/lomakkeet/106080/lomakkeet.html) to fill in the [bespoke analysis](https://www.finngen.fi/en/members/document/249) proposal.

Link to the form can also be found from the finngen.fi [members area](https://www.finngen.fi/en/members/dashboard) (under Tools and Resources).

For any questions or concerns, please contact: [finngen-admin@helsinki.fi](file://ad.helsinki.fi/home/m/maavikko/Desktop/finngen-admin@helsinki.fi)


# How are bespoke analysis proposals handled?

### Bespoke analysis proposal procedure

#### 1. **Proposals are evaluated by the FinnGen Scientific Director and the FinnGen administration team**

The bespoke analysis proposals are reviewed by the FinnGen Administrators, including Scientific Director and Data Protection Office, who check that the proposal is in line with the overall [FinnGen Scientific Plan](https://www.finngen.fi/en/members/document/218) and its amendments ([FinnGen 2 Scientific Plan](https://www.finngen.fi/en/members/document/217) and [FinnGen 3 Scientific Plan](https://www.finngen.fi/en/members/document/1354)) and any biobank and registry permissions granted to FinnGen. You may be asked to provide additional information on the proposal.

After review by the FinnGen Administrators, a copy of the bespoke analysis proposal is distributed to the biobanks for their information.

In case a biobank finds that the bespoke analysis proposal is not in line with the granted biobank permit, FinnGen Administators may ask to modify the bespoke analysis proposal.

#### 2. Approval if contracts are in place

In case all necessary contracts are in place (including Joint Controller Agreement with University of Helsinki) the approval process takes 1-3 weeks.

#### 3. After the approval

After the approval of your bespoke analysis proposal, you will receive an analysis proposal index (B\_YYYY\_NNN), which may be asked from you when you are in contact with FinnGen staff for services. You are also asked the index when requesting to download results out from Sandbox.

Please be in contact with <finngen-admin@helsinki.fi> if you don't remember your bespoke analysis index.

Once your bespoke analysis proposal has been approved, we (FinnGen) will follow up your progress regularly. Your final results and manuscript should be shared with University of Helsinki.

Once you have your results ready, please be in contact `finngen-admin@helsinki.fi` for more guidance.


# What is the difference between FinnGen analysis proposals and FinnGen bespoke analyses?

There are two main differences between FinnGen analysis and [FinnGen bespoke analyses](https://www.finngen.fi/en/members/document/249).

### Breadth of result sharing

The first difference regards the breadth of results sharing. In the case of FinnGen analyses the results should be shared with all FinnGen Partners, whereas in the case of FinnGen bespoke analyses, the individual level results need to be shared only with the University of Helsinki and your organization. However, the final results of bespoke analyses shall be published as well.

### Data controller

The second difference is the data controller. In the case of FinnGen analysis the data controller is the University of Helsinki. The University of Helsinki determines the purpose and means to use the data. FinnGen bespoke analysis requires a joint controller agreement to be drafted, agreed and signed between the University of Helsinki and your organization. In FinnGen bespoke analysis the joint controllers together determine the purpose and means to use the data.

In both cases **all analyses** done using FinnGen data **need to** also **have** **articulated scientific purpose** and **potential to produce publishable results**.

For information contact <finngen-admin@helsinki.fi>


# Existing analysis proposals

The list existing analysis proposals is available [here](https://www.appsheet.com/start/ea608933-2713-4eec-a08e-b06703fb0ea1). If you have any issues in accessing the Appsheet (access is with the finngen account),[ ](https://tt.eduuni.fi/sites/hy-finngen/All/)please send a message to <finngen-servicedesk@helsinki.fi>.


# Finnish Health Registries and Medical Coding

Finland boasts as one of the few countries which has truly rich electronic health records: essentially tracking a Finn from birth till death.

![](https://3072695768-files.gitbook.io/~/files/v0/b/gitbook-x-prod.appspot.com/o/spaces%2F-MhYL0UTLjqsuIdK0SSO%2Fuploads%2Fgit-blob-20e451c9e7af7a74f324da9c0cad8bf4454b5f98%2FScreen%20Shot%202021-09-26%20at%208.43.35%20PM.png?alt=media)

In this section, we describe the Finnish health registries and the medical coding that you can use as an analyst to "create" your own phenotypes or further interrogate your analytical curiosities:

* [**Finnish Health Registries**](/finngen-data-specifics/finnish-health-registers-and-medical-coding/finnish-health-registers)
* [**Register data pre-processing**](/finngen-data-specifics/finnish-health-registers-and-medical-coding/register-data-pre-processing)
* [**Data Masking/Blurring of Visit Dates**](/finngen-data-specifics/finnish-health-registers-and-medical-coding/data-masking-blurring-of-visit-dates)
* [**International and Finnish Health Code Sets**](/finngen-data-specifics/finnish-health-registers-and-medical-coding/international-and-finnish-health-code-sets)
* [**More information on health code sets**](/finngen-data-specifics/finnish-health-registers-and-medical-coding/more-information-on-health-code-sets)
* [**VNR code mapping to RxNorm**](/finngen-data-specifics/finnish-health-registers-and-medical-coding/vnr-code-mapping-to-rxnorm)
* [**Register code translation files**](/finngen-data-specifics/finnish-health-registers-and-medical-coding/where-to-find-the-translation-file-for-phenotype-data)


# Finnish health registries

The FinnGen study is based on combining genetic and electronic health record data. Finnish health care system was presented in [FinnGen users' meeting on the 14th of June 2022](https://www.finngen.fi/en/members/document/322), which was [recorded](https://www.finngen.fi/en/members/recordings/finngen-data-users-meeting-14th-june-2022).

![](https://3072695768-files.gitbook.io/~/files/v0/b/gitbook-x-prod.appspot.com/o/spaces%2F-MhYL0UTLjqsuIdK0SSO%2Fuploads%2Fgit-blob-d41ecb80be751a02418013f3421200240e2ee9ba%2FScreen%20Shot%202021-09-26%20at%208.44.16%20PM.png?alt=media\&token=bef64856-3708-467f-9dc2-670dc641ccd4)

The study enables users to use the registry data, for [FinnGen Scientific Plan](https://www.finngen.fi/en/members/document/218) and its [amendments](https://www.finngen.fi/en/members/document/217) based purposes, from the following national registries (*details in table below, containing live links*):

![](https://3072695768-files.gitbook.io/~/files/v0/b/gitbook-x-prod.appspot.com/o/spaces%2F-MhYL0UTLjqsuIdK0SSO%2Fuploads%2Fgit-blob-3157d3f3699dbeb6e6ad57fbaaf22d9676503b37%2Fkuva%20\(18\).png?alt=media)

### Finnish registries used in FinnGen

FinnGen contains data from a large number of Finnish registers. This data is only available in the Sandbox. The registers available in FinnGen are described in:

* [Register data](/finngen-data-specifics/red-library-data-individual-level-data/what-phenotype-files-are-available-in-sandbox-1/registers-in-the-detailed-longitudinal-data)


# Register data pre-processing

FinnGen register team receives raw register data from the [registries](/finngen-data-specifics/finnish-health-registers-and-medical-coding/finnish-health-registers), and performs pre-processing for the data, before creating phenotype files and releasing data files to the Sandbox.

Raw register data includes PICs (personal identification number) for each individual. The register team has created FINNGENIDs for each PIC, and these FINNGENIDs are used for both genotype and phenotype data.

### **Pre-processing actions of the register data**

* Replace PIC with FINNGENID
* Create EVENT AGE using birth date from the PIC and event date (eg. arrival date to the hospital, or date when the drug was purchased)
* Create SEX using PIC (if the 10th letter of the PIC is even the individual is female)
* Harmonize variables from the different years of the registry (variable names have been changing during the years)
* Combine different register data years to the same data file
* Convert date variables to yyyy-mm-dd format
* Create [ICDVER](/finngen-data-specifics/red-library-data-individual-level-data/what-phenotype-files-are-available-in-sandbox-1/detailed-longitudinal-data) based on the year of the diagnosis (ICD8: 1967-1986; ICD9: 1987-1995; ICD10: since 1996; ICD-O-3: cancer registry)
* Separate inpatient and outpatient data based on PALA (service type) variable (HILMO)
* Create other register-specific variables; eg, PARITY, NRO CHILD, NRO FETUSES in [reproductive history register](/finngen-data-specifics/red-library-data-individual-level-data/what-phenotype-files-are-available-in-sandbox-1/other-registers); or kidney variables in [kidney register](/finngen-data-specifics/red-library-data-individual-level-data/what-phenotype-files-are-available-in-sandbox-1/other-registers).
* \*Create [HOSPDAYS ](/finngen-data-specifics/red-library-data-individual-level-data/what-phenotype-files-are-available-in-sandbox-1/detailed-longitudinal-data)variable (hospital departure date deducted from hospital arrival date; HILMO)
* \*Create [APPROX EVENT DATE](/finngen-data-specifics/finnish-health-registers-and-medical-coding/data-masking-blurring-of-visit-dates) by blurring/masking the exact event date (see the link in this line for more information about this process)
* \*Remove denials (individuals who have asked to have their data removed from FinnGen)

\*done later in data processing


# Data Masking/Blurring of Visit Dates

All FinnGen individual-level data is pseudo-anonymised: Personal Identity codes (PICs) are replaced by FinnGen IDs, and **only pseudo-anonymised individual-level data can be found in Sandbox.**

### < 5 cases rules

In **DF1-DF7** all register codes with less that five cases within detailed longitudinal data, and all endpoints with less than 5 cases in endpoint and longitudinal endpoint data **have been removed** from the data.

**DF8v3 onwards** all register codes in detailed longitudinal data and all endpoints in endpoint and endpoint longitudinal data, also those with less than 5 cases, **are included** in the data released to the Sandbox.

### Randomized event days

In order to protect individual-level data, exact event days cannot be released with phenotype data. Exact event dates are randomized to an approximated event day (`APPROX_EVENT_DAY`) by adding **+/- 1-15 days** (offset) to the exact event day.

The number added to the exact event day is consistent within individual (*individual-specific*), meaning that the same number (offset) is added to all events of the individual.

* **Until DF10, offset** **is not consistent across registers**. The `APPROX_DAY` is usually calculated separately in each register (eg. [reproductive history data](/finngen-data-specifics/red-library-data-individual-level-data/what-phenotype-files-are-available-in-sandbox-1/other-registers) vs. [service sector data](/finngen-data-specifics/red-library-data-individual-level-data/what-phenotype-files-are-available-in-sandbox-1/other-registers)). However in the [detailed longitudinal data](/finngen-data-specifics/red-library-data-individual-level-data/what-phenotype-files-are-available-in-sandbox-1/detailed-longitudinal-data) the same individual-specific offset is used for particular individual in all registers included in the data.
* **From DF11 forward offset is consistent across registers**. Same offset per person (consistent for all event of 1 person) is used for all FinnGen register files.


# International and Finnish Health Code Sets

Finnish health registries consist of several specific code sets in order to trace healthcare data.

The main code sets used are:

* **Diagnosis codes**: ICD[8](https://www.julkari.fi/handle/10024/135324)/[9](https://www.julkari.fi/handle/10024/131850)/[10](https://www.julkari.fi/handle/10024/80324), [ICPC2](https://www.who.int/standards/classifications/other-classifications/international-classification-of-primary-care)
* **Operation codes**: [Nomesco- Finnish version](https://www.julkari.fi/bitstream/handle/10024/104401/URN_ISBN_978-952-245-858-2.pdf?sequence=1), [Nomesco](http://norden.diva-portal.org/smash/get/diva2:968721/FULLTEXT01.pdf), [Finnish Hospital league](https://version.helsinki.fi/ontology-group/ontologists/-/wikis/uploads/c6f5830c1ebc4b22025cd4b04090bc7d/Sairaalaliitto1983toimenpidekoodit.pdf) and Demanding Heart Patient (new/old coding), SPAT (Finnish primary care outpatient procedures)
* **Medication codes**: [ATC](https://www.whocc.no/atc_ddd_index/), Drug reimbursement, [VNR](https://wiki.vnr.fi/?page_id=36)
* **Cancer codes**: [ICD-O-3](https://apps.who.int/iris/bitstream/handle/10665/96612/9789241548496_eng.pdf)
* **Service Sector codes:** [FGVisitType](https://github.com/FINNGEN/FinOMOP_OMOP_vocabulary/tree/main/VOCABULARIES/FGVisitType)

The main registry data file in FinnGen is the [Detailed Longitudinal Data](/finngen-data-specifics/red-library-data-individual-level-data/what-phenotype-files-are-available-in-sandbox-1/detailed-longitudinal-data). It contains all of the above code sets, but these code sets may also be used in [other registry data](/finngen-data-specifics/red-library-data-individual-level-data/what-phenotype-files-are-available-in-sandbox-1/other-registers) in FinnGen, like [visual impairment registry data](/finngen-data-specifics/red-library-data-individual-level-data/what-phenotype-files-are-available-in-sandbox-1/other-registers), [reproductive history data](/finngen-data-specifics/red-library-data-individual-level-data/what-phenotype-files-are-available-in-sandbox-1/other-registers), [cervix and breast cancer screening data](/finngen-data-specifics/red-library-data-individual-level-data/what-phenotype-files-are-available-in-sandbox-1/other-registers) and [vaccination registry data](/finngen-data-specifics/red-library-data-individual-level-data/what-phenotype-files-are-available-in-sandbox-1/other-registers).

If you need more information on any of these codes, please see their own official documentation below or see [More information on health code sets.](/finngen-data-specifics/finnish-health-registers-and-medical-coding/more-information-on-health-code-sets)

### **Diagnosis codes:**

* [**Finnish ICD-10 book**](http://urn.fi/URN:NBN:fi-fe201205085423)
* [**Finnish ICD-9 book**](http://urn.fi/URN:NBN:fi-fe201701261356)
* [**Finnish ICD-8 book**](http://urn.fi/URN:NBN:fi-fe201710058910)
* [**ICPC2**](https://www.who.int/standards/classifications/other-classifications/international-classification-of-primary-care) **codes**
* [**ICPC2 book**](https://version.helsinki.fi/ontology-group/ontologists/-/wikis/uploads/f4e625cf0248df895d05b82563e8dafb/ICPC-kirja-kuntaliitto_p20100309095440223.pdf) (in Finnish)
* [**ICPC2 flyer**](https://version.helsinki.fi/ontology-group/ontologists/-/wikis/uploads/7555389397b957a9e4a89f0e8c4c9c9e/ICPC_2_english_flyer.pdf)

### **Cancer codes:**

* [**ICD-O-3 book**](https://apps.who.int/iris/bitstream/handle/10665/96612/9789241548496_eng.pdf) (WHO)
* [**ICD-O-3 book**](https://version.helsinki.fi/ontology-group/ontologists/-/wikis/uploads/d78b97d21db630caf0b5a978773971d8/ICD-O-3_kolmas_painos.pdf) (Finnish cancer register, in Finnish)

### **Operation and procedure codes:**

* [**Nomesco - Finnish version**](https://www.julkari.fi/bitstream/handle/10024/104401/URN_ISBN_978-952-245-858-2.pdf?sequence=1)
* [**Nomesco book**](http://norden.diva-portal.org/smash/get/diva2:968721/FULLTEXT01.pdf)
* [**Finnish Hospital league book**](https://version.helsinki.fi/ontology-group/ontologists/-/wikis/uploads/c6f5830c1ebc4b22025cd4b04090bc7d/Sairaalaliitto1983toimenpidekoodit.pdf) (in Finnish)

### **Medication codes:**

* [**ATC**](https://www.whocc.no/atc_ddd_index/) **codes** (WHO)
* [**ATC**](https://version.helsinki.fi/ontology-group/ontologists/-/wikis/uploads/97955814c41f60099661f108c3ac9340/atc_codes_wikipedia.csv) **codes** (Wikipedia)
* [**ATC** ](https://version.helsinki.fi/ontology-group/ontologists/-/wikis/uploads/9d4e8e78f67534b72bc534ce01510116/atc.txt)**codes (**[fimea](https://www.fimea.fi/laakehaut_ja_luettelot/perusrekisteri), in Finnish)
* [**VNR**](https://wiki.vnr.fi/?page_id=36) **codes**

#### **See also:**

[**National health data code service**](https://91.202.112.142/codeserver/pages/classification-list-page.xhtml?clearUserCachedLists=true) (in Finnish)

[**Fimea**](https://www.fimea.fi/web/en/databases_and_registers/basic-register)


# More information on health code sets

## **Register code sets** <a href="#register-code-sets" id="register-code-sets"></a>

Inpatient Hilmo registry (INPAT) and Specialist outpatient Hilmo registry (OUTPAT), as well as the cause of death registry (DEATH), include ICD[8](https://www.julkari.fi/handle/10024/135324)/[9](https://www.julkari.fi/handle/10024/131850)/[10](https://www.julkari.fi/handle/10024/80324), diagnosis codes, but ICD codes can also be found in the drug reimbursement (REIMB) and primary care (PRIM\_OUT) registries. ICD codes used in the registries span three versions: ICD8 (years 1967-1986), ICD9 (years 1987-1995) and ICD10 (since 1996). In addition to diagnosis codes, the inpatient Hilmo and Specialized outpatient Hilmo registries contain operation/surgery codes; [Nomesco](https://finngen.gitbook.io/documentation/r6/) codes, [Finnish hospital league surgery codes](https://version.helsinki.fi/users/sign_in) and demanding heart patient procedure codes. The cancer registry (CANC) contains [ICD-O-3](#register-code-sets) cancer codes (topography, morphology and behaviour codes), whereas the PRIM\_OUT registry contains cause of visit diagnosis codes (ICD/[ICPC2](https://www.who.int/standards/classifications/other-classifications/international-classification-of-primary-care)), operation codes (SPAT), and dental codes (MOP)

<figure><img src="https://3072695768-files.gitbook.io/~/files/v0/b/gitbook-x-prod.appspot.com/o/spaces%2F-MhYL0UTLjqsuIdK0SSO%2Fuploads%2Fgit-blob-5cb02af4a6d6e693ae54a869e46de357a09ad5c4%2FN%C3%A4ytt%C3%B6kuva%202022-8-29%20kello%2010.22.54.png?alt=media" alt=""><figcaption></figcaption></figure>

**Figure 1.** Code sets within [detailed longitudinal data](/finngen-data-specifics/red-library-data-individual-level-data/what-phenotype-files-are-available-in-sandbox-1/detailed-longitudinal-data).

### Finnish/Nordic specific code sets

Some of the code sets are Finnish specific (or Nordic specific) and not used anywhere else. Such code sets include

* Drug reimbursement codes in REIMB registry
* The Finnish hospital league surgery codes from the OPER\_IN and OPER\_OUT registries
* Heart patient codes (new and old codes) from the OPER\_IN and OPER\_OUT registries
* SPAT and Dental codes from the PRIM\_OUT registry.
* [Nomesco](http://norden.diva-portal.org/smash/get/diva2:968721/FULLTEXT01.pdf) operation codes (OPER\_IN and OPER\_OUT registry) are commonly used in northern countries (Nordic Medico-Statistical Committee)

In addition, many of the ICD and ATC codes are Finnish-specific.

Finnish versions of ICD-[8](https://www.julkari.fi/handle/10024/135324)/[9](https://www.julkari.fi/handle/10024/131850)/[10](https://www.julkari.fi/handle/10024/80324), **are not** the same as the US clinical modification, nor the international [WHO ICD](https://version.helsinki.fi/ontology-group/ontologists/-/wikis/uploads/10e1070d546c2e0a514b2675b1080b35/ICD-10-WHO-2016.pdf) (although the Finnish versions extend and modify the WHO versions).

The Death registry, however, uses only the WHO ICD and not any of the Finnish extensions.

Hereafter ICD refers to the Finnish versions unless otherwise stated. This is the reason why when using registry data it should always be remembered that **Finnish codes do not match with**, for example, **international classification of the diseases** (ICD10-CM). However, [ICD-O-3](https://apps.who.int/iris/handle/10665/42344) for cancer events follows the international version and consists of topography (TOPO), morphology (MORPHO) and behaviour (BEH) cancer codes.

### Codes assigned by physician or nurse

It is also worth keeping in mind that [ICPC2](https://www.who.int/standards/classifications/other-classifications/international-classification-of-primary-care) (diagnosis codes) and SPAT (operation codes) from the primary care registry (PRIM\_OUT) can be assigned by a nurse, whereas ICD codes are always assigned by a physician. This is a reason why one should consider whether to add PRIM\_OUT registry codes to self-made endpoints.

Physicians can decide whether they prefer to use ICD or [ICPC2](https://www.who.int/standards/classifications/other-classifications/international-classification-of-primary-care) codes, and this preference may also change regionally in Finland.

### Dental codes

Dental codes are part of [Nomesco](http://norden.diva-portal.org/smash/get/diva2:968721/FULLTEXT01.pdf) codes, where THL (The Finnish Institute for Health and Welfare) has made some extensions. The Nomesco coding has an indicator as to whether it's a dental (odontological) procedure code or not. PRIM\_OUT codes have been piloted in FinnGen endpoint data; endpoints that have an ending “\_INCLAVO” also contain PRIM\_OUT codes.

The Kela drug purchase registry (PURCH) and Kela drug reimbursement registry (REIMB) consist of the following medical code sets: the [ATC drug identifier code](https://www.whocc.no/atc_ddd_index/), drug reimbursement codes and drug product number [VNR](https://wiki.vnr.fi/?page_id=36).

## **What are ATC codes?**

The Anatomical Therapeutic Chemical (ATC) codes are unique codes which are designated to drugs according to the targeted organ system and drug function (therapeutic, pharmacological, and chemical properties). This classification is highly curated and maintained by the World Health Organization (WHO).

The classification is broken down to 5 levels:

Level 1: A system of 14 anatomical or pharmacological groups (Figure 2)

<figure><img src="https://3072695768-files.gitbook.io/~/files/v0/b/gitbook-x-prod.appspot.com/o/spaces%2F-MhYL0UTLjqsuIdK0SSO%2Fuploads%2Fgit-blob-e0f77ca54e5873d5ac8ddbbfd9b82aa4ca5ed436%2Fimage%20(570).png?alt=media" alt=""><figcaption></figcaption></figure>

**Level 1** breakdown of the 14 anatomical and pharmacological groups (source: <https://www.who.int/tools/atc-ddd-toolkit/atc-classification>)

**Level 2** Pharmacological or therapeutic groups

**Level 3 and 4** Chemical, Pharmacological or Therapeutic subgroup

**Level 5** Chemical substance

More appropriately, the 2nd, 3rd, and 4th levels are more often used to determine pharmacological subgroups than therapeutic or chemical subgroups.

As an example, Escitalopram (a commonly used Selective Serotonin Reuptake Inhibitor (SSRI) antidepressant) has an ATC code of `N06AB10`:

| N       | Nervous System (1st level, anatomical group)                                  |
| ------- | ----------------------------------------------------------------------------- |
| N06     | Psychoanaleptics (2nd level, therapeutic group)                               |
| N06A    | Antidepressants (3rd level, therapeutic group)                                |
| N06AB   | Selective Serotonin Reuptake Inhibitors (SSRI) (4th level, therapeutic group) |
| N06AB10 | Escitalopram (5th level, Chemical substance)                                  |

More information on ATC codes can be found [here](https://www.who.int/tools/atc-ddd-toolkit/atc-classification).

## **What are VNR codes?**

The VNR codes are Nordic country-specific codes known as the Nordic Article Number. These codes are used for the **identification of specific drugs and medicinal articles** which have been approved to be marketed in Nordic countries, including Finland.

The VNR codes are **6-digit codes** ranging from 000001-199999 and 370000-599999.

They are **assigned to** all **human medicines, veterinary medicines, herbal medicines, and traditional herbal medicines**. Numbers outside of this range are called ​​National Article Numbers which are used differently depending on the country

These codes are specific to how each of these drug/medicinal articles are marketed and can be then mapped to the article package size and dose. In the previous example (ATC code section) of using Escitalopram, a specific VNR code is keyed into the Kela drug registry when the drug article is purchased or reimbursed.

If person A purchased Escitalopram with VNR code X, code X will give you information on the number of pills and the dose of each pill in the article package that was purchased.

**Note!** Sometimes ATC-code of the medicine may have changed during the years. [Here ](https://www.whocc.no/atc_ddd_alterations__cumulative/atc_alterations/)you can find all ATC alterations performed in the period 2005-2021.

####

#### Translation file for register codes

Please see [Location of translation file for register codes ](/finngen-data-specifics/finnish-health-registers-and-medical-coding/where-to-find-the-translation-file-for-phenotype-data)to find translations of the FinnGen register codes and [Location of FinnGen endpoint description file](/finngen-data-specifics/endpoints/where-the-finngen-endpoint-description-file-is-located) to find out where the endpoint definition file is located.


# VNR code mapping to RxNorm

Details of VNR codes in finngen R6 mapped to standard RxNorm

The [VNR codes](https://www.laaketietokeskus.fi/en/pharmaceutical-information/vnr-services) are Nordic country-specific codes known as [the Nordic Article Number](https://wiki.vnr.fi/?page_id=36). The VNR codes are 6-digit codes ranging from 000001-199999 and 370000-599999. They are assigned to all human medicines, veterinary medicines, herbal medicines, and traditional herbal medicines. Numbers outside this range are called ​​National Article Numbers which are used differently depending on the country.

[RxNorm](https://www.nlm.nih.gov/research/umls/rxnorm/overview.html) terminology on the other hand, is US specific terminology and provides normalized names for medications allows linking to many drug vocabularies commonly used in the US market.

We have mapped the Nordic country-specific VNR codes to RxNorm in FinnGen R6. **Although the initial mapping was performed in R6 and is located in library-green in finngen\_R6 folder the mapping can be used with any Data Freeze/Release.**

The mapping and readme are located:

`/finngen/library-green/finngen_R6/finngen_R6_medical_codes/fgVNR.tsv`

`/finngen/library-green/finngen_R6/finngen_R6_medical_codes/fgVNR_readme.txt`

### How the VNR code to RxNorm mapping was done:

1. VNR codes originating from different sources within FinnGen were combined into single table called 'OriginalVNR'
2. Additional information on VNR codes with missing drug name, strength, ingredient information were requested from [Pharmaceutical Information Centre](https://www.laaketietokeskus.fi/en) (Lääketietokeskus). This information is stored in the table 'ltklVNR'
3. Missing ingredient information of VNR codes was filled using ATC codes.
4. Administration routes, dosage forms and units were created for codes in both 'OriginalVNR' + 'ltklVNR' tables.
5. We processed source text format of Package, Substance, Substance strength, Administration Route and Dosage Form for both 'OriginalVNR' + 'ltklVNR' tables.
6. We used [OHDSI drugmapping tool](https://github.com/EHDEN/DrugMapping) to map the parsed VNR code information to map to standard RxNorm

More details till step 5 from can be found in [github repository](https://github.com/FINNGEN/VNRIngredientsTable/tree/fixes_sam/tasks).

Description of the columns of fgVNR.tsv are shown in below table.

<table><thead><tr><th width="202">Column Name</th><th>Column Type</th><th>Description</th><th>Example</th></tr></thead><tbody><tr><td>VNR</td><td>INT64</td><td>six-digit VNR code.</td><td>518</td></tr><tr><td>ATC</td><td>STRING</td><td>ATC group code</td><td>N05AH04</td></tr><tr><td>MedicineName</td><td>STRING</td><td>Commerical Name</td><td>SEROQUEL</td></tr><tr><td>AdministrationRouteSourceTextFI</td><td>STRING</td><td>Administration route in text format as in source.</td><td>Suun kautta</td></tr><tr><td>AdministrationRoute</td><td>STRING</td><td>Valid value for administration route.</td><td>Oral use</td></tr><tr><td>DosageFormSourceTextFI</td><td>STRING</td><td>Dosage form in text format as in source.</td><td>tabletti, kalvopäällysteinen</td></tr><tr><td>DosageForm</td><td>STRING</td><td>Valid value for dosage form.</td><td>film-coated tablet</td></tr><tr><td>PackageSourceTextFI</td><td>STRING</td><td>Package info in text format as in source.</td><td>10 FOL</td></tr><tr><td>PackageSize</td><td>FLOAT64</td><td>Size of package in float format.</td><td>10</td></tr><tr><td>PackageFactor</td><td>INT64</td><td>Factor of package in float format.</td><td>1</td></tr><tr><td>PackageUnit</td><td>STRING</td><td>A valid unit value.</td><td>fol</td></tr><tr><td>SubstanceSourceTextFI</td><td>STRING</td><td>List of substances as in source.</td><td>quetiapine</td></tr><tr><td>Substance</td><td>STRING</td><td>Substance name. one row per substance.</td><td>quetiapine</td></tr><tr><td>SubstanceStrengthTextFI</td><td>STRING</td><td>Substance's strength in text format as in source.</td><td>25+100+200 mg</td></tr><tr><td>Strength</td><td>STRING</td><td>Mapped or fixed or split substance strength. If not then source strength used.</td><td>100 mg</td></tr><tr><td>SubstanceStrengthNumenatorValue</td><td>FLOAT64</td><td>Substance's strength value in numerator in float format.</td><td>100</td></tr><tr><td>SubstanceStrengthNumenatorUnit</td><td>STRING</td><td>A valid unit value.</td><td>mg</td></tr><tr><td>SubstanceStrengthDeominatorValue</td><td>FLOAT64</td><td>Substance's strength value in denominator in float format.</td><td>1</td></tr><tr><td>SubstanceStrengthDeominatorUnit</td><td>STRING</td><td>A valid unit value</td><td>1</td></tr><tr><td>ValidRange</td><td>BOOL</td><td>True if VNR is en the valid range (less than 200000 or between 370000 and 599999)).</td><td>TRUE</td></tr><tr><td>Source</td><td>STRING</td><td>From which table the code was taken.</td><td>ltklVNR or "originalVNR"</td></tr><tr><td>Status</td><td>STRING</td><td>How well the medicine has been processed</td><td>incomplete_dosageForm</td></tr><tr><td>VNRnew</td><td>STRING</td><td>A temporary VNR code created for drugs with single substance multiple strength values. Temporary VNR code will have letters a or b or c attached to the end.</td><td>000518a</td></tr><tr><td>calculateTotalStrength_message</td><td>STRING</td><td>How well the strength has been processed.</td><td>correct or "missmatch"</td></tr><tr><td>TotalStrength</td><td>FLOAT64</td><td>Total Strength of the drug which is PackageSize * PackageFactor * Dosage</td><td>10 * 1 * 100 = 1000</td></tr><tr><td>TotalStrengthUnit</td><td>STRING</td><td>Total Strength valid unit</td><td>mg</td></tr><tr><td>n_codes</td><td>INT64</td><td>Frequency of the VNR code</td><td>260</td></tr><tr><td>Dosage</td><td>FLOAT64</td><td>SubstanceStrengthNumenatorValue/SubstanceStrengthDeominatorValue</td><td>100/1 = 100</td></tr><tr><td>DosageUnit</td><td>STRING</td><td>A valid unit value</td><td>mg</td></tr><tr><td>MedicineNameFull</td><td>STRING</td><td>Commerical Name, Dosage Form and SubstanceStrength</td><td>SEROQUEL 25+100+200 mg</td></tr></tbody></table>

The fgVNR.tsv file was used as the input for [OHDSI drugmapping tool](https://github.com/EHDEN/DrugMapping). The tool requires VNR code with substance information followed by dosage form and drug strength. If no substance information is present then there will be no mapping.

* [DrugMapping tool](https://github.com/EHDEN/DrugMapping) requires a [Common Data Model (CDM)](https://github.com/OHDSI/CommonDataModel/tree/v5.3.2) database with vocabulary data. To create the CMD, we:
  * Extracted CDM database schema from OHDSI common data model for Version 5.3.2 of CDM.
  * Created the CDM database schema in a PostgreSQL server Version 14.2
  * Changes were made in the CDM V5.3.2 SQL files generated from [OHDSI common data model](https://github.com/OHDSI/CommonDataModel/tree/v5.3.2) due to PostgreSQL server Version is > 9.
  * Downloaded the Vocabulary data of Default vocab list + Addition vocabularies for "Dosage Form" from [Athena](https://athena.ohdsi.org/search-terms/start).
  * Uploaded the Vocabulary data from [Athena ](https://athena.ohdsi.org/search-terms/start)to the PostgreSQL CDM v5.3.2 database
* Once the CDM database was up and running from PostgreSQL, we started setting up the [DrugMapping Tool](https://github.com/EHDEN/DrugMapping)
  * [DrugMapping Tool](https://github.com/EHDEN/DrugMapping) does following maps. We did "Clinical Drug Map" ![](https://3072695768-files.gitbook.io/~/files/v0/b/gitbook-x-prod.appspot.com/o/spaces%2F-MhYL0UTLjqsuIdK0SSO%2Fuploads%2Fgit-blob-f8cce4518a10f244d95ac7f8bedc041e74a7db6b%2FClincalDrugMaps.png?alt=media)
  * Input file for [DrugMapping tool](https://github.com/EHDEN/DrugMapping) was formatted to add missing columns ![](https://3072695768-files.gitbook.io/~/files/v0/b/gitbook-x-prod.appspot.com/o/spaces%2F-MhYL0UTLjqsuIdK0SSO%2Fuploads%2Fgit-blob-9f5203fcd86d626c38ed9d564943a09e50e42a64%2FVNRInputFileDrugMappingToolMap.png?alt=media)
  * Information regarding the possible Clinical drug mapping possible along with total number of input drugs

    <table data-header-hidden><thead><tr><th width="526"></th><th></th></tr></thead><tbody><tr><td>Input</td><td>Value</td></tr><tr><td>Total Drugs</td><td>15,928</td></tr><tr><td>Drugs with non-missing VNR Codes</td><td>15,902</td></tr><tr><td>Unique VNR codes</td><td>14,655</td></tr><tr><td>Drugs with non-missing VNR codes + Ingredient Codes</td><td>13,876</td></tr><tr><td>Drugs with non-missing VNR codes + Ingredient Codes + dosage form</td><td>12,897</td></tr><tr><td>Drugs with non-missing VNR codes + Ingredient Codes + dosage form + dosage value</td><td>12,644</td></tr><tr><td>Drugs with non-missing VNR codes + Ingredient Codes + dosage form + dosage + dosage unit</td><td>12,638</td></tr></tbody></table>
* After fixing the Input file for [DrugMapping Tool](https://github.com/EHDEN/DrugMapping), it created three intermediary files
  * Ingredient Name Translation File
  * Unit Mapping File
  * Dose Form Mapping File
* All the three intermediary files need to be filled carefully
  * Ingredient Name Translation File - Simplest to fill using the input file
  * Unit Mapping File
    * Source units were to be mapped to standard units such as 'mg' and 'mL'. Example

      <table><thead><tr><th width="116">SourceUnit</th><th width="118">DrugCount</th><th width="135">RecordCount</th><th width="105">Factor</th><th width="126">TargetUnit</th><th>Comment</th></tr></thead><tbody><tr><td>%</td><td>303</td><td>1109084</td><td>0.01</td><td>mg/mg</td><td><br></td></tr><tr><td>IU</td><td>309</td><td>400416</td><td>1</td><td>[U]</td><td><br></td></tr><tr><td>U</td><td>25</td><td>360</td><td>1</td><td>[U]</td><td><br></td></tr><tr><td>g</td><td>160</td><td>1614186</td><td>1000</td><td>mg</td><td><br></td></tr><tr><td>g/l</td><td>8</td><td>1112</td><td>1</td><td>mg/mL</td><td><br></td></tr><tr><td>mg</td><td>20905</td><td>68649900</td><td>1</td><td>mg</td><td><br></td></tr><tr><td>mg/days</td><td>111</td><td>54182</td><td>0,289</td><td>mg/h</td><td><br></td></tr><tr><td>mg/h</td><td>5</td><td>455</td><td>1</td><td>mg/h</td><td><br></td></tr><tr><td>milli.IU</td><td>73</td><td>478234</td><td>1000000</td><td>[U]</td><td><br></td></tr><tr><td>ml</td><td>5</td><td>4885</td><td>1</td><td>mL</td><td><br></td></tr><tr><td>ug/puffs</td><td>6</td><td>212536</td><td>0.001</td><td>mg/{actuat}</td><td><br></td></tr></tbody></table>
    * Dose Form Mapping File
      * First thing is to extract all the dose form in domain "Drug" with concept\_class "Dose Form" from all the vocabularies in the CDM database.
      * Second thing is to extract "relationship\_id" of "Source - RxNorm eq" from CONCEPT\_RELATIONSHIP table for all non-standard "Dose Form" from "additional vocabularies".
      * Match the cells in "DoseFrom" to the extracted standard dose forms which was only 49 out of 147 dose forms.
      * Manually filled out 85 dose forms with only 13 dose forms missing having low frequency. Example of filled dose form file can be seen below

        <table><thead><tr><th width="139">DoseForm</th><th width="90">DrugCount</th><th width="93">Priority</th><th width="122">concept_id</th><th width="100">concept_name</th><th>Comments</th></tr></thead><tbody><tr><td>BASIC CREAM</td><td>11</td><td><br></td><td>19082224</td><td>Topical Cream</td><td><br></td></tr><tr><td>BATH ADDITIVE</td><td>1</td><td><br></td><td>19082228</td><td>Topical Solution</td><td><br></td></tr><tr><td>BODY LOTION</td><td>1</td><td><br></td><td><br></td><td><br></td><td><br></td></tr><tr><td>CAPSULE</td><td>279</td><td>0</td><td>19082168</td><td>Oral Capsule</td><td>Standard</td></tr><tr><td>CAPSULE</td><td>279</td><td>1</td><td>19021887</td><td>Capsule</td><td>Non-Standard</td></tr><tr><td>CAPSULE, HARD</td><td>664</td><td><br></td><td>19082168</td><td>Oral Capsule</td><td><br></td></tr></tbody></table>
    * The result of [DrugMapping Tool](https://github.com/EHDEN/DrugMapping) after carefully filling out all three files can be shown below

      Percentage of possible drugs mapped is 12,089 of 12,638 (95.6%)

      <table data-header-hidden><thead><tr><th width="381"></th><th></th></tr></thead><tbody><tr><td>Source drugs mapped to Clinical Drug</td><td>12089 of 14692 (82.283%)</td></tr><tr><td>Source drugs mapped to Clinical Drug Form</td><td>562 of 14692 (3.825%)</td></tr><tr><td>Source drugs mapped to Clinical Drug Comp</td><td>354 of 14692 (2.409%)</td></tr><tr><td>Source drugs mapped to Ingredient</td><td>588 of 14692 (4.002%)</td></tr><tr><td>Source drugs mapped Splitted</td><td>74 of 14692 (0.504%)</td></tr><tr><td>Source drugs mapped Splitted Incomplete</td><td>3 of 14692 (0.02%)</td></tr><tr><td>Source drugs mapped Total</td><td>13670 of 14692 (93.044%)</td></tr><tr><td>Source drugs mapped to None</td><td>1022 of 14692 (6.956%)</td></tr></tbody></table>


# Register code translation files

Code definitions of each code set and their translations in english can be found from the Members area [here](https://www.finngen.fi/en/members/document/293) and from the Sandbox (paths below):

## Medcode\_reference:

**Diagnoses and procedure codes (as well as KELA codes) in Sandbox:**

**FinnGen R9:**

`/finngen/library-green/finngen_R9/finngen_R9_medical_codes/finngen_R9_medcode_ref.tsv`

`/finngen/library-green/finngen_R9/finngen_R9_medical_codes/finngen_R9_medcode_ref_readme.txt`

**FinnGen R6:**

`/finngen/library-green/finngen_R6/finngen_R6_medical_codes/finngen_R6_medcode_ref.tsv`

`/finngen/library-green/finngen_R6/finngen_R6_medical_codes/finngen_R6_medcode_ref_readme.txt`

**Diagnoses and procedure codes (as well as KELA codes) in google cloud:**

**FinnGen R9:**

`gs://finngen-production-library-green/finngen_R9/finngen_R9_medical_codes/finngen_R9_medcode_ref.tsv`

`gs://finngen-production-library-green/finngen_R9/finngen_R9_medical_codes/finngen_R9_medcode_ref_readme.txt`

**FinnGen R6:**

`gs://finngen-production-library-green/finngen_R6/finngen_R6_medical_codes/finngen_R6_medcode_ref.tsv`

`gs://finngen-production-library-green/finngen_R6/finngen_R6_medical_codes/finngen_R6_medcode_ref_readme.txt`

## Drugcode\_reference:

**ATC codes in Sandbox:**

`/finngen/library-green/finngen_R6/finngen_R6_medical_codes/ATC_translate_minimal.txt`

`/finngen/library-green/finngen_R6/finngen_R6_medical_codes/ATC_translate_minimal.txt.READ`

**ATC codes in google cloud:**

`gs://finngen-production-library-green/finngen_R6/finngen_R6_medical_codes/ATC_translate_minimal.txt`

`gs://finngen-production-library-green/finngen_R6/finngen_R6_medical_codes/ATC_translate_minimal.txt.READ`

**VNRO codes in Sandbox:**

`/finngen/library-green/finngen_R6/finngen_R6_medical_codes/finngen_R6_drugcode_ref.tsv`

`/finngen/library-green//finngen_R6/finngen_R6_medical_codes/finngen_R6_drugcode_ref_readme.txt`

**VNRO codes in google cloud:**

`gs://finngen-production-library-green/finngen_R6/finngen_R6_medical_codes/finngen_R6_drugcode_ref.tsv`

`gs://finngen-production-library-green/finngen_R6/finngen_R6_medical_codes/finngen_R6_drugcode_ref_readme.txt`

**FinnGen VNR data in Sandbox:**

FinnGen VNR data provide VNR mapping to RxNorm and between VNR codes and ATC codes, and including dosage, package info, package size, substance name and strength, valid unit value (e.g. "mg"), a factor of the package, calculated total strength of the drug, and commercial name, dosage Form, and Substance Strength of the drug.

Even though VNR data is generated from the codes available on DF6, it can be used for all release data. The VNR codes are available for all data releases.

**VNR codes in Sandbox:**

`/finngen/library-green/finngen_R6/finngen_R6_medical_codes/fgVNR.tsv`

`/finngen/library-green/finngen_R6/finngen_R6_medical_codes/fgVNR_readme.txt`

`/finngen/library-green/finngen_R6/finngen_R6_medical_codes/fgVNR_table_definition.tsv`

**VNR codes in google cloud:**

`gs://finngen-production-library-green/finngen_R6/finngen_R6_medical_codes`


# Endpoints

The FinnGen endpoints are carefully curated phenotypes based on the Finnish registers and register code sets.

In this section, we elaborate on:

* [**FinnGen clinical endpoints**](/finngen-data-specifics/endpoints/finngen-clinical-endpoints)
* [**History of creating the FinnGen endpoints**](/finngen-data-specifics/endpoints/history-of-creating-the-finngen-endpoints)
* [**Location of FinnGen Endpoint and Control Description Files**](/finngen-data-specifics/endpoints/where-the-finngen-endpoint-description-file-is-located)
* [**Interpretation of Endpoint Definition File**](/finngen-data-specifics/endpoints/how-to-interpret-endpoint-definition-file)
* [**Location of Endpoint Quality Control Report**](/finngen-data-specifics/endpoints/endpoint-quality-control-for-data-freeze-8)
* [**Creating a User-defined Endpoint**](/finngen-data-specifics/endpoints/link-to-how-to-make-a-user-defined-endpoint)
* [**Requesting a User-defined Endpoint to be included in Core Analysis**](/finngen-data-specifics/endpoints/requesting-a-user-defined-endpoint-to-be-part-of-core-analysis)
* [**Complete follow-up time of the FinnGen registries - primary endpoint data**](/finngen-data-specifics/endpoints/complete-follow-up-time-of-the-finngen-registries-primary-endpoint-data)


# FinnGen clinical endpoints

[FinnGen clinical endpoints](https://www.finngen.fi/en/researchers/clinical-endpoints), or simply FinnGen endpoints, are considered as indicators that a certain medical condition has occurred. This could be, e.g., an acute event such as Covid-19 infection, or onset of a chronic disease, such as cardiovascular disease. We use multiple registers for endpoint definitions including care register for healthcare (hospital discharges, specialist outpatient visits, operations and procedures), causes-of-death from [Statistic Finland](https://www.stat.fi/index_en.html), medicine purchases and drug reimbursements from [Kela](https://www.kela.fi/medicine-expenses), and specific cancer diagnoses from [Finnish Cancer Registry](https://cancerregistry.fi/). For example, if a person is discharged from a hospital with an [ICD-10 code G43.1 (Migraine with aura)](https://icd.who.int/browse10/2016/en#/G43), an endpoint of [migraine](https://risteys.finregistry.fi/endpoints/G6_MIGRAINE) is assigned to the person's FinnGen data. Many of these registers cover almost half a decade of data. This means that different versions of e.g. Finnish specific [ICD](/finngen-data-specifics/finnish-health-registers-and-medical-coding/international-and-finnish-health-code-sets) codes (versions 8,9 and 10) have been used, requiring harmonization of the data and endpoint definitions.

Within the FinnGen project we set up to create a comprehensive endpoint library (available [here](https://www.finngen.fi/en/researchers/clinical-endpoints)) of health/disease endpoint definitions covering the whole 21 chapters of diseases in ICD-10, in a hierarchical manner. Our library generally follows the ICD-10 hierarchy where chapters are divided into code blocks of similar diseases, containing three- character categories, of usually single diseases, and four-character subcategories, usually disease subtypes. Some small changes were made into the hierarchy mainly when the ICD-8/9 codes necessitated. For some diseases the medicine purchases or reimbursements are a great source of information, and for cancers, we use the [Finnish Cancer Registry](https://cancerregistry.fi/) data, which is coded in ICD-O-3.

Besides the ICD-10 based hierarchy, our endpoint library contains some more specific endpoints of interest within FinnGen, that could be overlapping with each other or the hierarchical endpoints. Currently we provide 4 648 endpoint definitions, including some diseases that are quite rare in the population. Besides the endpoint definitions, we provide suggested control exclusion criteria for each endpoint; these are used in the FinnGen GWAS association analyses.

In order to make the endpoints more comparable with other disease endpoint efforts and more easily searchable, we have matched our endpoints with disease ontology coding systems, using DOID, EFO, and MESH codes. This matching has been done with an automatic customized algorithm, following manual curation.

We have also created a [Risteys portal](https://risteys.finngen.fi/) to browse the endpoints. Find out how to use Risteys [here](/working-outside-the-sandbox/risteys-as-an-option-for-browsing-endpoints).

Compared to the whole Finnish population, FinnGen will in the end contain 500 000 participants (\~10% of the Finnish population). FinnGen is enriched with disease cases from hospital biobanks and disease specific '[legacy' cohorts](/finngen-data-specifics/red-library-data-individual-level-data/genotype-data/affymetrix-chip-and-its-design/legacy-cohorts-and-chips) deposited to Finnish biobanks. Thus FinnGen is well suited for genetic epidemiological studies, but due to the selection bias, it is not suitable for assessing accurate population prevalence of diseases.

FinnGen corrects endpoint and control exclusion criteria when necessary and creates new endpoints and control exclusion criteria each Data Freeze. You can access the current and previous endpoint and control exclusion criteria libraries [here.](https://www.finngen.fi/en/researchers/clinical-endpoints) The libraries are also available in Sandbox [here](https://finngen.gitbook.io/finngen-analyst-handbook/finngen-data-specifics/endpoints/where-the-finngen-endpoint-description-file-is-located).


# History of creating the FinnGen endpoints

Concept, definitions and format, register data processing and actual endpoint algorithms

*Dr. Aki Havulinna, MD Tuomo Kiiskinen, Dr. Susanna Lemmelä, Sami Koskelainen, Dr. Tero Hiekkalinna, Dr. Elisa Lahtela, Prof. Hannele Laivuori*

The vision by Dr. **Havulinna**: create a comprehensive set of harmonized endpoints on diseases and health related conditions, covering the whole ICD-10. Provide tools to harmonize and preprocess the data and plan and implement the algorithm that creates the actual endpoints from the definitions and register data. This work has been and will be openly available to benefit the whole Finnish and international clinical and medical research community, not only the FinnGen project.

## Prior to FinnGen

The root of the endpoint concept lies in the work of Dr. Havulinna and prof. **Veikko Salomaa** since 2006. We needed some harmonized, multiregister-based cardiometabolic endpoints for our research work with the FINRISK data (N=30 000). The multiple registers included were register for healthcare (hospital discharges, special care outpatient visits, surgical operations and procedures), causes-of-death, KELA registers of medicine purchases and drug reimbursements, and cancer register. These registers cover almost half a decade of data, during which, e.g., Finnish specific ICD versions 8,9 and 10 have been used. Therefore, harmonization of the data and endpoint definitions was required.

The few cardiometabolic endpoints were soon expanded to a dozen. Havulinna created a set of SAS macros with which the endpoint rules for each endpoint were manually programmed in, and the macros would be applicable to different data sets (e.g., separate FINRISK survey years). Soon, even this approach was too tedious for continuously adding new endpoints.

Havulinna decided to create a systematic approach where endpoint definitions would be entered in a simple structured document and processed automatically by an R-script to create the actual register-based endpoints. This was the beginning of the endpoint definition excel and the original FINRISK endpoint scripts. Around the year 2016 these concepts and scripts were used in the FIMM/THL/Pharma collaboration project which was a pilot/prequel to the FinnGen project.

Some 200 endpoints were drafted by prof. Hannele Laivuori and prof. **Markus Perola**, based on the suggestions by participating pharma companies. Havulinna formalized the endpoint definitions in the excel format, and together with Dr. **Mervi Kinnunen** and bioinformatician **Elina Kilpeläinen** we ran the R-scripts to create the endpoints. Havulinna heavily improved and modified the scripts to gain speed and cope with various data related issues. The endpoint concept and scripts were now ready for a major new challenge.

## FinnGen

In FinnGen the endpoint goals were set as follows (by Havulinna and Laivuori as leaders of the Clinical team):

1\. **The primary endpoints**: Pharmaceutical companies each was asked to provide a list of \~10 of their main interest endpoints

* a. We divided the listed endpoints into disease categories (ICD-10 chapters)
* b. For each disease category we established a clinical expert group of Finnish medical scholars and pharma representatives. The expert groups are listed at <https://www.finngen.fi/en/clinical_expert_groups>, but the structure of the groups has changed; in the original format, there were about a dozen group members besides the lead and secretary: experts representing all Finnish university hospitals, and Pharma companies with interest in the diseases in question. Besides the six original expert groups – Neurology, Gastroenterology, Rheumatology, Pulmonary diseases, Cardiometabolic diseases, Oncology – several new groups have emerged later-on. Original member lists can be seen in the list of collaborators in earlier FinnGen publications.
* c. The expert groups helped in creating and fine-tuning the endpoints of interest, with varying amount of contribution by each group.

2\. **PheWAS approach**: This constitutes the *bulk of the endpoints*. Given the large amount of data to be collected, and overrepresentation of diseased individuals (due to FinnGen samples being based on a major part on hospital biobank samples) we wanted to create as wide a range of disease endpoints as possible – e.g., for a hypothesis free study of genetic association of diseases.

Next, doctoral researcher, MD **Tuomo Kiiskinen** joined the clinical team. This was the beginning of the huge job to create the **FinnGen endpoint library** for PheWAS. We proceeded by adding one ICD-10 chapter at a time, prioritizing more important (to FinnGen) chapters. The work by Kiiskinen for one chapter lasted 3-4 weeks, after which Havulinna made initial semi-automated checks to ensure the consistency of the hierarchical structure, and obvious errors in diagnosis codes or other things. The original approach (by Kiiskinen) for each chapter was as follows:

1. Follow roughly the ICD-10 treelike structure <https://icd.who.int/browse10/2019/en#/> - to the level of detail that would still make sense in the context of genetic analyses. For example, usually the .8 is "other specified", and .9 is "unspecified" so they were always combined into Other / unspecified (=*non aliter specificatus*, NAS), because if the "other" is not specified it is also equal to unspecified).
2. Manually match the ICD-10 code with Finnish ICD-9 and ICD-8. A 1:1:1 match is usually impossible, so for every endpoint there was a decision whether the ICD-10 structure should be modified, usually by combining codes, or whether the earlier versions were so outdated compred to ICD-10 that the ICD-8/9 codes were dropped into the NAS category)
3. For every endpoint this was NOT straightforward; besides medical knowledge it required studying the diseases (Terveysportti, Wikipedia, literature, etc.) to make the best decisions, so it really took a lot of time.
4. See if there are any specific drug reimbursement codes that would cover these endpoints
5. See if there are any disease specific drug purchase ATC-codes that would match these endpoints
6. Check if clinical groups had any specific requests and either a) modify the already made endpoints b) create these requests as additional “custom/design” endpoints (=composite endpoints)
7. Submit the work to Havulinna for initial checks, potential corrections and for running the actual endpoints in the FINRISK data, to see that everything works and how the endpoint case distributions look like
8. Present the work (Kiiskinen, Havulinna) to the primary clinical expert group and to others.

At this point we did not have the Finnish ICD-8 or ICD-9 in an electronic format, which would have helped a lot. We only had PDF-copies of the original books, scanned and processed by Havulinna:

ICD-9: <http://urn.fi/URN:NBN:fi-fe201701261356>

ICD-8: <http://urn.fi/URN:NBN:fi-fe201710058910>

Our first release of the endpoint library (January, 2018), for FinnGen DF1 contained 2057 endpoints covering the ICD-10 Chapters 1-14. The endpoint algorithm already had the “INCLUDE” and “CONDITION” rules, and possibility to create sex-specific endpoints. We also provided for each endpoint the control exclusion/eligibility rules, which were determined by Havulinna, mainly algorithmically to exclude closely resembling diseases from controls.

Kiiskinen and Havulinna, with support from Laivuori, provided a unique combination of expertise, without which the FinnGen endpoint library would not exist.

## FinnGen, further developments

For each consecutive data freeze (DF) we refined existing endpoints where problems were found, and added new endpoints based on the suggestions from the FinnGen community. After the first FinnGen DFs, we improved some endpoints from GWAS-based experience, e.g., exclusion of T1D from T2D cases (the overlap was detected because of a clear HLA signal in T2D GWAS; due to their autoimmune nature, HLA associations are known to be specific to T1D), and a similar thing happened with UC vs Crohn’s disease.

For each DF Havulinna also improved his endpoint algorithm written as R scripts, introduced some new concepts there, and usually also created the actual endpoints and preprocessed the register data. Register team lead at that time, Dr. **Kati Kristiansson** ran the endpoint scripts for some DFs, with Havulinna doing debugging. Dr. **Susanna Lemmelä** joined the Clinical team and the Register team in Feb. 2019, and she took over much of the [register data](/finngen-data-specifics/finnish-health-registers-and-medical-coding) processing and actual [endpoint data ](/finngen-data-specifics/red-library-data-individual-level-data/what-phenotype-files-are-available-in-sandbox-1/endpoint-and-endpoint-longitudinal-data)creation, since DF3.

The original FinnGen study permission for several DFs was restricted so that we could only release the derived endpoints based on several registers, and not any original register data which was kept within the FinnGen register team at THL. Since DF2 we have released [endpoint longitudinal data](/finngen-data-specifics/red-library-data-individual-level-data/what-phenotype-files-are-available-in-sandbox-1/endpoint-and-endpoint-longitudinal-data), containing all events and source register information, besides the original first-ever event release.

The original endpoint scripts utilized the original register data in the wide format, rather unchanged. Few things, such as EVENT\_AGE, were added in the preprocessing. Starting in 2019, when the register permission became more liberal, so that the diagnosis codes could also be released to the FinnGen sandbox (a secure computing environment, which allows researchers from all over the world to do research and analyses on the enriched data of the FinnGen project), we discussed a new, harmonized longitudinal register data format which would contain only the essentials (e.g., source register, age of diagnosis, diagnosis codes) to allow easy browsing of the events even without endpoint scripts. Drs. **Andrea Ganna** and **Juha Karjalainen** participated in formulating the [detailed longitudinal data](/finngen-data-specifics/red-library-data-individual-level-data/what-phenotype-files-are-available-in-sandbox-1/detailed-longitudinal-data) concept, and Lemmelä quickly prepared the necessary detailed longitudinal data scripts with Havulinna helping. [Detailed longitudinal data ](/finngen-data-specifics/red-library-data-individual-level-data/what-phenotype-files-are-available-in-sandbox-1/detailed-longitudinal-data)has been released using these detailed longitudinal data scripts since mid-2019 (DF4). It took some time before the longitudinal data format was adopted as the basis for endpoint creation, as it required a complete rewrite of the original endpoint scripts.

The Covid era from 2020 onwards led to several changes also for the FinnGen endpoints. Kiiskinen had left after DF5 to focus on pursuing his PhD. Havulinna did the DF6 endpoint definition update. He added the missing ICD-10 chapters, 15-22. Chapter 15 (Pregnancy, childbirth and the puerperium) was harmonized by Laivuori and Havulinna, while chapters 16-22 still remain unharmonized.

Also, during DF6, Dr. Tero Hiekkalinna started programming the *Endpointter*, an alternative implementation of Havulinna’s endpoint algorithm written in Python. Endpointter was written in the perspective of the detailed longitudinal source data, whereas the original R-scripts were written for the wide-format register data as received from the original register authorities. Havulinna has also prepared a new version of the R-scripts, adapted for the detailed longitudinal register data. Starting in Jan 2021 (DF7), the endpoints have been created using the Endpointter scripts. Starting with DF6v3, bioinformatician Sami Koskelainen took over the endpoint data creation process, running the endpoint scripts.

Dr. **Elisa Lahtela** joined FinnGen and the Clinical team in April 2020, and in DF7 took over the Endpoint definition updating tasks from Havulinna, who (along with Laivuori) switched mainly to an advisory role when FinnGen2 started (August 2020). Endpoint changes were for the major part frozen, and during DF7-8 we cleaned the endpoint set from redundant endpoints and decided on a core set of endpoints to avoid doing an expensive GWAS for closely correlated endpoints.

Since DF3 we have also committed to improved QC, in collaboration with the register and analysis teams. Lemmelä created quality control R-scripts for the endpoint and endpoint longitudinal data and ran case/control correlations, Jaccard indices and clusters for the FinnGen endpoints. Since DF7, Havulinna has written a set of R-scripts for automatically updating the endpoints by a structured Excel containing the changes; for checking the consistency of the endpoints, including the hierarchy; and for creating an endpoint definition change log. The register team now follows and updates a rigorous QC procedure to ensure the quality of the register data, the endpoint definitions, and the endpoints created from the register data. Starting in DF9-10, Koskelainen with help from Lemmelä, who is a product owner of the [FinnGen Clinical endpoints](https://www.finngen.fi/en/researchers/clinical-endpoints), has taken the main responsibility for the whole FinnGen endpoint data creation process.


# Location of FinnGen Endpoint and Control Description Files

The FinnGen endpoint and control description file can be found [here](https://www.finngen.fi/en/researchers/clinical-endpoints).

Both files are also located with the phenotype data in Sandbox from:

`/finngen/library-red/finngen_R[RELEASE]/phenotype_[version]/documentation/`

Note. If multiple versions of the files exist, we recommned using the newest one. Readmes describe the difference of the versions.


# What's new in DF14 endpoints

The changes in DF14 endpoints are listed below.

* **New WIDE version endpoints created (Primary health care codes \[Avohilmo] added)**
  * 95 infectious disease endpoints (naming: AB1\_XXX\_WIDE)
  * H7\_CONJUNCTIVITISACUNONATOPIC\_WIDE
  * H7\_EYELIDINFLAMMATION\_WIDE
  * H8\_NONSUPPNAS\_WIDE
  * L12\_ACNE\_WIDE
* **New WIDE version endpoints created (additional codes added)**
  * AUTOHEP\_WIDE
* **New WIDE versions cancer endpoints created (Hospital inpatient codes \[Hilmo] added)**
  * C3\_BONE\_CARTILAGE\_WIDE
  * C3\_COLORECTAL\_WIDE
  * C3\_DIGESTIVE\_ORGANS\_WIDE
  * C3\_ENDOCRINE\_WIDE
  * C3\_EYE\_BRAIN\_NEURO\_WIDE
  * C3\_FEMALE\_GENITAL\_WIDE
  * C3\_HEAD\_AND\_NECK\_WIDE
  * C3\_MALE\_GENITAL\_WIDE
  * C3\_MESTOTHEL\_SOFTTISSUE\_WIDE
  * C3\_RESPIRATORY\_INTRATHORACIC\_WIDE
  * C3\_SKIN\_WIDE
  * C3\_URINARY\_TRACT\_WIDE
  * C3\_LIQUID\_CANCER\_WIDE
  * C3\_SOLID\_CANCER\_WIDE
* **New phenotypes created**
  * Primary Sclerosing Cholangitis, IBD and UDCA required (K11\_PSC)
  * Benign thyroid growths and nodules (THYGROWTHS)
  * Primary biliary cholangitis, wide definition (K11\_PBC\_WIDE)
  * Urinary track infection (N14\_UTI\_FEMALE\_WIDE)
  * Malignant neoplasm (C3\_SOLID\_LIQUID\_CANCER)
  * Malignant neoplasm, including Hilmo (C3\_SOLID\_LIQUID\_CANCER\_WIDE)
* **Endpoint definition corrected:**
  * M13\_SLE
  * Q17\_PDA
  * N14\_UTER\_POLYP
  * PACEMAKER
  * C3\_MELANOMA
  * C3\_MELANOMA\_WIDE
  * INFLUENCA
  * C3\_LIVER\_INTRAHEPATIC\_BILE\_DUCTS
  * C3\_LIVER\_INTRAHEPATIC\_BILE\_DUCTS\_WIDE
  * LUNG\_CANCER\_MESOT
  * K11\_KELAIBD
  * RHEUMA\_SEROPOS\_WIDE
  * E4\_THYROID
  * MYELOPROF
  * C3\_KIDNEY\_NOTRENALPELVIS\_WIDE
  * C3\_LIQUID\_CANCER
  * C3\_CANCER
  * C3\_CANCER\_WIDE
  * C3\_SOLID\_CANCER
* **Renamed endpoints (definitions not changed)**
  * M13\_OVERLAP renamed as M13\_MCTD
  * H7\_OPTATROPHY renamed as H7\_OPTATROPHY\_WIDE
  * AB1\_DIBTHERIA renamed as AB1\_DIPTHERIA
  * AB1\_DIBTHERIA\_WIDE renamed as AB1\_DIPTHERIA\_WIDE
  * C3\_EPENDYDOMA renamed as C3\_EPENDYMOMA
  * N14\_UTER\_POLYP renamed as N14\_CERVIC\_POLYP
  * CD2\_FOLLICULAR\_LYMPHOMA renamed as C3\_FOLLICULAR\_LYMPHOMA
  * CD2\_HODGKIN\_LYMPHOMA renamed as C3\_HODGKIN\_LYMPHOMA
  * CD2\_IMMUNOPROLIFERATIVE renamed as C3\_IMMUNOPROLIFERATIVE
  * CD2\_INDEPENDENT\_MULTIPLE\_SITES renamed as C3\_INDEPENDENT\_MULTIPLE\_SITES
  * CD2\_INDEPENDENT\_MULTIPLE\_SITES\_NAS renamed as C3\_INDEPENDENT\_MULTIPLE\_SITES\_NAS
  * CD2\_LEUKAEMIA\_NAS renamed as C3\_LEUKAEMIA\_NAS
  * CD2\_LYMPHOID\_LEUKAEMIA renamed as C3\_LYMPHOID\_LEUKAEMIA
  * CD2\_MONOCYTIC\_LEUKAEMIA renamed as C3\_MONOCYTIC\_LEUKAEMIA
  * CD2\_MULTIPLE\_MYELOMA\_PLASMA\_CELL renamed as C3\_MULTIPLE\_MYELOMA\_PLASMA\_CELL
  * CD2\_MYELOID\_LEUKAEMIA renamed as C3\_MYELOID\_LEUKAEMIA
  * CD2\_NEOPLASM renamed as C3\_NEOPLASM
  * CD2\_NONFOLLICULAR\_LYMPHOMA renamed as
  * CD2\_NONHODGKIN\_NAS renamed as C3\_NONHODGKIN\_NAS
  * CD2\_OTHER\_LEUKAEMIA\_SPECIFIED renamed as C3\_OTHER\_LEUKAEMIA\_SPECIFIED
  * CD2\_OTHER\_SPECIAL\_TNK\_LYMPHOMA renamed as C3\_OTHER\_SPECIAL\_TNK\_LYMPHOMA
  * CD2\_PRIMARY\_LYMPHOID\_HEMATOPOIETIC renamed as C3\_PRIMARY\_LYMPHOID\_HEMATOPOIETIC
  * CD2\_PRIMARY\_LYMPHOID\_HEMATOPOIETIC\_NAS renamed as C3\_PRIMARY\_LYMPHOID\_HEMATOPOIETIC\_NAS
  * CD2\_TNK\_LYMPHOMA renamed as C3\_TNK\_LYMPHOMA
  * CD2\_UVEAMELANOMA renamed as C3\_UVEAMELANOMA
* **Core endpoint status updated (WILL be part of the R14 core GWAS analyses)**
  * C3\_ASTROCYTOMA
  * C3\_BASAL\_CELL\_CARCINOMA
  * C3\_BREAST\_HER2NEG\_WIDE
  * C3\_BURKITT\_WIDE
  * C3\_HEART\_MEDIASTINUM\_PLEURA\_WIDE
  * C3\_TONSIL\_WIDE
* **Core endpoint status updated (WON’T be part of the R14 core GWAS analyses)**
  * AB1\_DERMATOPHYTOSIS
  * AB1\_ERYSIPELAS
  * AB1\_HERPES\_SIMPLEX
  * AB1\_VIRAL\_SKIN\_NOS
  * AB1\_ZOSTER
  * C3\_BURKITT
  * C3\_CIRCULATING\_LYMPHOID
  * C3\_DIGESTIVE\_ORGANS
  * C3\_ENDOCRINE
  * C3\_EYE\_BRAIN\_NEURO
  * C3\_FEMALE\_GENITAL
  * C3\_HEAD\_AND\_NECK
  * C3\_MALE\_GENITAL
  * C3\_MEDULLOBLASTOMA
  * C3\_MESTOTHEL\_SOFTTISSUE
  * C3\_OVARY\_MUCINO
  * C3\_OVARY\_SEROUS
  * C3\_RESPIRATORY\_INTRATHORACIC
  * C3\_SKIN
  * C3\_SQUAMOUS\_CELL\_CARCINOMA\_SKIN
  * C3\_TONSIL
  * C3\_URINARY\_TRACT
  * C3\_SOLID\_CANCER
  * C3\_LIQUID\_CANCER
  * C3\_WILMS\_TUMOR
  * AB1\_SCARLET\_FEVER\_WIDE
  * AB1\_VIRAL\_OTHER\_INTEST\_INFECTIONS\_WIDE
* **New tags added**
  * CD2 tag added to 22 endpoints
  * C3 tag added to 8 endpoints
  * INSITU tag added 64 endpoints


# What's new in DF13 endpoints

There are some bigger gaterorical changes in DF13 endpoints:

* Cancer endpoints
* New rare diseases endpoints·
* Pruning of dental endpoints·
* Avohilmo added to especially infectious diseases endpoints

**Cancer endpoints**

Background: Previously cancer endpoints differed in both case and control definitions:

* Core endpoints, C3\_XXX\_EXALLC **Renamed C3\_XXX\_WIDE**
  * Definition:
    * Cases: Hilmo + Cancer registry
    * Controls: All cancers excluded
* Non-core endpoints, C3\_XXX **All cancers excluded from controls**
  * Definitions:
    * Cases: Cancer registry
    * Controls: Cases excluded from controls
* Additional haematological cancers, e.g. C\_LYMPHOMA **Omitted**
  * Definition:
    * Cases: Hilmo
    * Controls: Cases excluded from controls

Changes made for DF13:

* C3\_XXX\_EXALLC
  * **Renamed as C3\_XXX\_WIDE**
* C3\_XXX
  * **All cancers excluded from controls, name stays the same**
* Additional haematological cancers, e.g. C\_LYMPHOMA
  * **Removed**
* If \_WIDE version couldn’t be created (no ICD-10 codes), \_ExAlL versions removed and only normal version remained

As a summary, in DF13 all cancer endpoints have same control definition and differ only by case definitions, which will result two cancer endpoint categories: \_WIDE with Hilmo included and original with only Cancer registry data.

**New rare disease endpoints**

* 106 new rare disease endpoints added
* Selection criteria
  * Case count > 30

**Dental endpoint pruning**

* Satu Strauz et al have gone through and curated all dental endpoints
* 3 new endpoint
  * Pulpitis
  * Necrosis of pulp
  * Periapical abscess
* 38 modified endpoints
  * Most are additions of avohilmo, change of control defintitions or name/longname changes
* 74 endpoints omitted (omit 1 or 2)

**Wider infectious and congenital diseases endpoints (Primary health care codes \[Avohilmo] added)**

* Many infectious disease endpoints (AB1\_XXX\_WIDE)
* Many congenital disease endpoint (Q17\_XXX\_WIDE)

**Additional smaller changes**

* Renaming
  * G6\_AD\_WIDE renamed to AD\_STRICT
    * Background:
      * G6\_AD\_WIDE was renamed as G6\_NEURODEGENERATION in DF12
      * G6\_AD\_WIDE was redefined but redefinition resulted this being narrower than G6\_ALZHEIMER
  * ESOSINOPHIL\_DISEASE -> EOSINOPHIL\_DISEASE
* New phenotypes
  * Lupus nephritis, neuromyelitis optica and membraneous nephropathy
  * Raynaud syndrome
  * Excessive earwax
  * Solid and liquid cancers
  * Wider kidney endpoints
    * All kidney diseases
    * Chronic kidney diseases wide
* Codes corrected or added to:
  * I9\_NONISCHCARDMYOP\_STRICT
  * AB1\_CHOLERA
  * I9\_HYPERTROCARDMYOP
  * I9\_POSTAMI
  * H8\_ACOUSNERVDIS
  * Avohilmo added to insomnia endpoint
* 3 medication endpoints had wrong ATC codes
  * THIAZOLINEDIONES
  * DPP4INH
  * GLP1ANA
* Added back as core endpoints
  * R18\_MALAI\_FATIG
  * I9\_STR\_SAH
  * T1D\_WIDE (T1D omitted)


# What’s new in DF12 endpoints

There were no systemic changes in Data Freeze (DF) 12 endpoints, only minor updates.

### DF12 legacy samples

New DF12 biobanked research study cohort samples, genotyped with the FinnGen array, were delivered from the following cohorts and biobanks:

* \~7900 The Finland-United States Investigation of NIDDM Genetics ([FUSION](https://thl.fi/en/web/thl-biobank/for-researchers/sample-collections/fusion-study)) study subjects from THL BB
* \~2200 Study subjects from asthma/COPD-cohort from Helsinki BB
* \~570 Finnish Health in Teens ([Fin-Hit](https://thl.fi/en/web/thl-biobank/for-researchers/sample-collections/fin-hit-study)) study subjects from THL BB
* \~70[ Migraine](https://thl.fi/en/web/thl-biobank/for-researchers/sample-collections/migraine-study) study subjects (THL BB)

### New DF12 legacy genotypes

New legacy samples with previously generated genotypes from non-FinnGen arrays were received for DF12

* \~ 300 Finnish Health in Teens study subjects ([Fin-Hit](https://thl.fi/en/web/thl-biobank/for-researchers/sample-collections/fin-hit-study), THL BB)

### Deleted endpoints

**Endpoints removed based on being redundant to other endpoints:**

SMOKING

C\_FOLLICULAR\_LYMPHOMA

C\_HODGKIN\_LYMPHOMA

C\_LYMPHOMA

C\_NONFOLLICULAR\_LYMPHOMA

C\_NONHODGKIN\_NAS

C\_OTHER\_SPECIAL\_TNK\_LYMPHOMA

C\_TNK\_LYMPHOMA

**DM1 and 2 complication endpoint deleted. Only the following DM complication endpoints exist in the DF12:**

DM2\_NEPHROPATHY

DM2\_RETINOPATHY

DM2\_NEUROPATHY

DM1\_NEPHROPATHY

DM1\_RETINOPATHY

DM1\_NEUROPATHY

**Deleted because of renaming:**

AB1\_GHLAMY\_OTHER - for renaming purpose

### New endpoints

**New rare congenital disease endpoints:**

E4\_FABRY\_KIDNEY

Q17\_MARFAN

Q17\_NEUROFIBROMATOSIS\_2

Q17\_NEUROFIBROMATOSIS\_1

Q17\_PEUTZ\_JEGHERS

Q17\_TUBEROUS\_SCLEROSIS

Q17\_VON\_HIPPEL

C3\_WILMS\_TUMOR\_EXALLC

Q17\_HIRSPRUNG

Q17\_ALPORT

E4\_APECED

Q17\_DIASTROFIC\_DYSP

D3\_ANGIOEDEMA\_1

D3\_ANGIOEDEMA\_2

D3\_ANGIOEDEMA\_3

Q17\_BICUSP\_AORTIC\_VALVE

Q17\_MASTOCYTOSIS

Q17\_NOONAN

Q17\_OSTEOGEN\_IMPERFECTA

**New hematological disease endpoints:**

C3\_MYELOMA\_MONOCLONAL

C3\_CIRCULATING\_LYMPHOID

C3\_AML\_MDS

**Other:**

DM\_RETINOPATHY\_STRICT

G6\_NEURODEGENERATIVE

M13\_EARLY\_LUMBAR\_PROLAPSE\_OPER

M13\_LUMBAR\_PROLAPSE

### Modified endpoints

**Cancer endpoints**

In DF12 we have added Hilmo based ICD codes to EXALLC cancer endpoints. In previous DFs these cancer endpoints were based on only the diagnoses from the Finnish Cancer Registry\_.\_ Case definitions without EXALLC in the name have the original definition without the Hilmo based ICD codes. Previously EXALLC cancer endpoints were defined by control file, but now EXALLC endpoints are listed also in the case definition file.

**Diabetic complication endpoints:**

DM\_NEPHROPATHY

DM\_RETINOPATHY

DM\_NEUROPATHY

Control definitions changed so that patients with diabetic complication are compared to diabetics without the complication

See endpoint [changelog](https://www.finngen.fi/en/researchers/clinical-endpoints) for more details.


# What’s new in DF11 endpoints

There were no systemic changes in Data Freeze (DF) 11's endpoints, only minor updates.

### DF11 legacy **samples**

New DF11 legacy **samples**, genotyped with the FinnGen array, were delivered from the following cohorts and biobanks:

* \~4700 The Finland-United States Investigation of NIDDM Genetics (FUSION) study subjects ([FUSION](https://thl.fi/en/web/thl-biobank/for-researchers/sample-collections/fusion-study), THL BB)
* \~3000 North Finland Birth Cohort study subjects born in 1986 ([NFBC 1986](https://www.oulu.fi/en/university/faculties-and-units/faculty-medicine/northern-finland-birth-cohorts-and-arctic-biobank), Arctic BB)
* \~1900 North Finland Birth Cohort study subjects born in 1966 ([NFBC 1966](https://www.oulu.fi/en/university/faculties-and-units/faculty-medicine/northern-finland-birth-cohorts-and-arctic-biobank), Arctic BB)
* \~1500 The diabetes register of the Vaasa hospital district study subjects ([DIREVA](https://www.vaasankeskussairaala.fi/globalassets/hallinnon-tiedostot/primarvardsenheten/direva---diabetesrekisteri/englanti/direva-info--suostumus-2018-engl.pdf), Auria BB)
* \~500 Northern Finland aging individuals ([Oulu 1935](https://www.oulu.fi/en/university/faculties-and-units/faculty-medicine/northern-finland-birth-cohorts-and-arctic-biobank), Arctic BB)
* \~650 Northern Finland aging individuals, ([Oulu 1945](https://www.oulu.fi/en/university/faculties-and-units/faculty-medicine/northern-finland-birth-cohorts-and-arctic-biobank), Arcitic BB)
* \~550 Finnish Health in Teens study subjects ([Fin-Hit](https://thl.fi/en/web/thl-biobank/for-researchers/sample-collections/fin-hit-study), THL BB)
* \~150 [Migrane](https://thl.fi/en/web/thl-biobank/for-researchers/sample-collections/migraine-study) study subjects (THL BB)
* \~30 [Finnish IPF](https://thl.fi/en/web/thl-biobank/for-researchers/sample-collections/finnish-ipf) study subjects (THL BB)

### New DF11 legacy genotypes

No new legacy samples **with previously generated genotypes from non-FinnGen arrays** were delivered to FinnGen for DF11.

All changes in the endpoints are described in the changelog file [here](https://www.finngen.fi/en/researchers/clinical-endpoints).

## Deleted endpoints

1 endpoint (custom endpoint, created for userresults)

* K11\_K03\_COMBINATION

## New endpoints

6 new endpoints

* DM2\_NEPHROPATHY
* DM2\_RETINOPATHY
* DM2\_NEUROPATHY
* DM1\_NEPHROPATHY
* DM1\_RETINOPATHY
* DM1\_NEUROPATHY

## Modified endpoints

336 modified endpoints

* 8 modified because typo in longname
* 10 endpoints with minor definition modifications
* 190 cancer control exclusions unified, now all EXALLC cancer endpoints have same exclusion rules
* Comorbidity and diabetes complication endpoints have now omit=2 (these endpoints won’t be released to Sandbox, Pheweb or Risteys)

See [changelog](https://www.finngen.fi/en/researchers/clinical-endpoints) for more details.


# What’s new in the DF10 endpoints

There were no systemic changes in Data Freeze (DF) 10's endpoints, only minor updates. Altogether 2459 new endpoints reached the minimum of 50 cases, making them eligible for the core analysis team GWAS runs.

### DF10 legacy **samples**

New DF10 legacy **samples**, genotyped with the FinnGen array, were delivered from the following cohorts and biobanks:

* \~2700 Finnish Health in Teens study subjects (Fin-HIT, THL BB)
* \~2350 male smokers (ATBC/SETTI study, THL BB)
* \~440 back surgery patients from the Nordic Modic project (Nomod study, Eastern Finland BB)
* \~950 normal pressure hydrocephalus patients, their relatives, and controls (Eastern Finland BB)
* \~705 neurological disease patients, including Alzheimer disease patients (L-MCI study, Eastern Finland BB)
* \~400 Kuopio Breast Cancer Project patients (KBCP, Eastern Finland BB)
* \~170 migraine family patients (Migraine study, THL)
* \~70 idiopathic intracranial hypertension patients (IIH cohort, Eastern Finland BB)
* \~50 acute head injury patients (S100B biomarker study, Eastern Finland BB)

### New DF10 legacy genotypes

New DF10 legacy **genotypes,** genotyped with various Illumina arrays, were delivered from the following cohorts and biobanks:

* \~4800 North Finland Birth Cohort study subjects born in 1966 (NFBC 1966, Arctic BB)
* \~3500 North Finland Birth Cohort study subjects born in 1986 (NFBC 1986, Arctic BB)

\
All changes in the endpoints are additionally described in the changelog file[ here](https://www.finngen.fi/en/researchers/clinical-endpoints).

### Deleted endpoints

50 endpoints were deleted:

* 18 deleted for renaming purposes; removed \_INCLAVO from short name
* 11 deleted due to other renaming purposes
* 14 redundant endpoints deleted
* 5 placeholder, 1 helper, and 1 too-broadly defined endpoint deleted.
* In addition, comorbidity and diabetes complication endpoints have now omit=2 (these endpoints won’t be released to Sandbox, Pheweb or Risteys)

###

###

### New endpoints

32 new endpoints were added:

* 2 new core endpoints
  * G6\_RLS
  * AB1\_LYME
* 1 new non-core endpoint
  * K11\_K03\_COMBINATION
* 29 new endpoints because of renaming
  * 18 \_INCLAVO endings removed from the endpoints' short names
  * 11 endpoints renamed because of spelling errors or illogical naming.

### Modified endpoints

81 endpoints were modified:

* 38 had an #AVO tag added
* 9 had an #ICDMAIN tag added
* 7 “special” columns were cleared as markings have become outdated
* 5 endpoints' long names or included names were changed
* 21 endpoint definitions were improved
* CD2\_NONHODGKIN\_NAS had its control definition corrected.

See the [changelog](https://www.finngen.fi/en/researchers/clinical-endpoints) for more details.


# What’s new in DF9 endpoints

For DF8 we made systematic changes to reduce the number of redundant endpoints, for DF9 there were no such systematic changes, only minor updates.

### **General changes in DF9 endpoints:**

* New [truncated endpoint file for survival analysis](/finngen-data-specifics/endpoints/complete-follow-up-time-of-the-finngen-registries-primary-endpoint-data/survival-analysis-using-the-truncated-endpoint-file-secondary-endpoint-data) done
  * In addition to “basic” endpoint file, Registry team provided [another endpoint](/finngen-data-specifics/endpoints/complete-follow-up-time-of-the-finngen-registries-primary-endpoint-data/survival-analysis-using-the-truncated-endpoint-file-secondary-endpoint-data) file where all the register data has been cut by the end of 2019 and the follow-up end date is calculated based on the 31.12.2019 (end of death register, which is the earliest to end, this is the end to which all other registers will be cut). This file can be used for Survival analyses.
* New registry data included:
  * External causes of morbidity codes were previously omitted from Hilmo, now added to DF9 (ICD Chapter VWXY endpoints)
* New enriched registry data collections added:
  * Eastern Finland aneurysm collection (this increased not only the numbers in the aneurysm endpoints but also some I9 indirectly modified (INCLUDE/CONDITION) endpoints)
* 128 new endpoints reaching PheWeb for the first time due to exceeding the minimum of 80 cases needed
* Cancer registry behaviour code requirements added to in C3\_ and CD2\_INSITU endpoints (see below for more detailed description of the changes)

### **Deleted endpoints:**

* HERPLUS/NEG breast cancer endpoints deleted and re-named to ERPLUS/NEG
  * C3\_BREAST\_HERPLUS - C3\_BREAST\_ERPLUS
  * C3\_BREAST\_HERNEG - C3\_BREAST\_ERNEG
  * RX\_HERPLUS- RX\_ERPLUS
  * RX\_HERNEG - RX\_ERNEG
* C3\_LIP\_ORAL\_PHARYNX deleted and replaced with a wider C3\_HEAD\_AND\_NECK endpoint
* C3\_NSCLC was deleted as C3\_LUNG\_NONSMALL\_EXALLC captures the phenotype better

### **New endpoints:**

* New depression endpoints
  * F5\_DEPRESSION\_DYSTHYMIA
  * F5\_DEPRESSION\_RECURRENT
  * F5\_DEPRESSION\_PSYCHOTIC
* New classification into biologically more meaningful entities for some cancer endpoints (C3/CD2\_INSITU)
* New Ear-Nose-Throat endpoints
  * C3\_TONSIL\_BASETONGUE
  * CD2\_BENIGN\_SALIVARY\_KNOWN
  * F5\_SPECIFIC\_SPEECH
  * F5\_READING Z21\_SPEECH\_THERAPY

### **Modified endpoints - main concepts:**

* Cancer endpoints:
  * Requirement of a behaviour code 3 (BEH3, denoting malignant tumors) in the Finnish Cancer Registry diagnoses was added to all C3\_ cancer endpoints
  * Requirement of a behaviour code 2 (BEH2 meaning *in situ* lesions) in the Finnish Cancer Registry diagnoses was added to all CD2\_INSITU\_ endpoints
* VWXY endpoints (External causes of morbidity):
  * previously omitted from Hilmo, now added to DF9 - case counts increased
  * wrong control exclusion rules corrected
  * some longnames corrected to English
* GRAVES\_COND - incorrect operation codes were corrected
* I9\_VALVES - operation codes were updated. This also affects endpoints that include this code; I9\_VHD, I9\_OTHHEART, and RG\_OTHHEART


# What’s new in DF8 endpoints

For DF8 the **number of endpoints was reduced**. This was done for a number of reasons - partly to reduce computational costs and also because nearly redundant endpoints could be confusing.

Endpoints were reduced through careful calculation of the case overlaps and consultation with the FinnGen clinical groups.

### Endpoints categorized into core and non-core endpoints

#### Core endpoints

* A FinnGen **core endpoint** is an **endpoint for which GWAS analysis** is run by FinnGen Analysis team. The results are shared in FinnGen [Google Cloud storage **green** bucket ](/finngen-data-specifics/green-library-data-aggregate-data/how-can-you-download-green-data)and one can browse them with **PheWeb.**

#### **Non-core endpoint**

* **Non-core endpoints are omitted from GWAS analyses,** but FinnGen study subjects are still assigned into these phenotypic endpoints by Endpointter. The endpoint definitions can still be browsed **in Risteys** and study subjects assigned to these can be accessed in **Sandbox.** One can use them eg. in Custom GWAS runs in Sandbox.

**Endpoints are categorized to core and non-core endpoints** using the **OMIT indicator** (column D in endpoint Spreadsheets (<https://www.finngen.fi/en/researchers/clinical-endpoints>). See below what type of endpoints were considered as non-core endpoints and therefore omitted from DF8 GWAS runs. In general and all endpoints with **n < 80 cases are excluded** from GWAS runs.

### What kind of endpoints were omitted from DF8 GWAS analyses

* Reduntant ICD-10 codes:
  * R18 Symptoms, signs and abnormal clinical and laboratory findings, not elsewhere classified
  * ST19 Injury, poisoning and certain other consequences of external causes
  * VWXY20 External causes of morbidity and mortality
  * Z21 Factors influencing health status and contact with health services
  * U22 Codes for special purpose
  * Level 1 endpoints (broad upper categories, ie AB1\_INFECTIONS)
* Correlated endpoints
  * Correlation runs on DF7
    * Correlated endpoints assigned to clusters
    * Top endpoint retained within each cluster
  * Clinical evaluation of “top endpoints”
* Systematic control selection for cancer endpoints
  * EXALLC version selected for malignant cancers (C3\_)
  * EXALLC version omitted for benign cancers (CD2\_BENIGN\_)

All FinnGen [core and non-core endpoints](https://www.finngen.fi/en/researchers/clinical-endpoints) can be found at FinnGen web pages.

• Spreadsheet: FINNGEN\_CORE\_AND\_NONCORE\_ENDPOINTS\_AND\_CONTROLS\_DF8


# Interpretation of Endpoint Definition file

This document explains how to attribute an endpoint to events in the detailed longitudinal data using the rules from the endpoint definition file (latest version at [FinnGen: Clinical Endpoints](https://www.finngen.fi/en/researchers/clinical-endpoints)). Have a look at the [list of gotchas](#gotchas) at the end of this document for some specificities that are easy to miss at first.

Each endpoint is defined by a set of rules, given as one line in the endpoint definition file. The detailed longitudinal file contains health events (*rows in that file*) that will be looked up against these rules. Each rule will add or remove events to the list of candidate events. Once all rules have been applied, the remaining candidate events are attributed to the endpoint.

#### When explaining the rules, the following terms are used:

* **Endpoint**: occurrence of a health event defined by rules that match on the health register data.
* **Candidate events**: list of events that could be attributed to the endpoint. This list grows and shrinks as the endpoint rules are applied.
* **Consider**: add event to the list of candidate events.
* **Discard**: remove event from the list of candidate events.

## Overview of the Endpoint Definition File

The endpoint definition file version 1.3 has the following metadata columns:

<table><thead><tr><th width="276">Column name</th><th>Explanation</th></tr></thead><tbody><tr><td><code>NAME</code></td><td>naming: Reference name in the FinnGen endpoint data</td></tr><tr><td><code>LONGNAME</code></td><td>naming: Descriptive name</td></tr><tr><td><code>Latin</code></td><td>naming: Latin name</td></tr><tr><td><code>TAGS</code></td><td>categorisation: List of categories the endpoint belongs to</td></tr><tr><td><code>LEVEL</code></td><td>categorisation: Level in the ICD-10 hierarchy</td></tr><tr><td><code>OMIT</code></td><td>categorisation: Is a core GWAS? (NA: yes, 1 or 2: no)</td></tr><tr><td><code>PARENT</code></td><td>categorisation: Parent in the ICD-10 hierarchy</td></tr><tr><td><code>version</code></td><td>changelog: introduced in data freeze</td></tr><tr><td><code>Modification_date</code></td><td>changelog: date of last modification</td></tr><tr><td><code>Modified_by</code></td><td>changelog: author of last modification</td></tr><tr><td><code>Modification_reason</code></td><td>changelog: purpose of modification</td></tr><tr><td><code>Special</code></td><td>free text notes</td></tr></tbody></table>

The rules are defined by the following columns in the endpoint definition file:\
\&#xNAN;*(Click on a value in "**Column name**" or "**Extra rules**"*, *where available*, *to be directed to further details that follow the table)*

| Column name                                   | Purpose                            | [Coding system](#appendix-coding-systems-and-translations) | [Lookup `SOURCE` registry](#appendix-list-of-registries) | Extra rules                                                                                                                         |
| --------------------------------------------- | ---------------------------------- | ---------------------------------------------------------- | -------------------------------------------------------- | ----------------------------------------------------------------------------------------------------------------------------------- |
| `SEX`                                         | Filter at the FINNGENID level      | –                                                          | –                                                        | –                                                                                                                                   |
| `INCLUDE`                                     | Use other endpoints to find events | –                                                          | –                                                        | –                                                                                                                                   |
| `PRE_CONDITIONS`                              | Filter at the event level          | –                                                          | –                                                        | –                                                                                                                                   |
| `CONDITIONS`                                  | Filter at the FINNGENID level      | –                                                          | –                                                        | –                                                                                                                                   |
| [OUTPAT\_ICD](#outpat_icd)                    | Inclusion lookup                   | ICD-10                                                     | `PRIM_OUT`                                               | [any-code](#any-code), [match-prefix](#match-prefix)                                                                                |
| [OUTPAT\_OPER](#outpat_oper)                  | Inclusion lookup                   | NOMESCO                                                    | `PRIM_OUT`                                               | [any-code](#any-code)                                                                                                               |
| [HD\_MAINONLY](#hd_mainonly)                  | Diagnosis selection hint           | –                                                          | `INPAT`, `OUTPAT`                                        | –                                                                                                                                   |
| [HD\_ICD\_10\_ATC](#hd_icd_-10-_atc)          | Inclusion lookup                   | ATC                                                        | `INPAT`, `OUTPAT`                                        | [any-code](#any-code), [match-prefix](#match-prefix)                                                                                |
| [HD\_ICD\_10](#hd_icd_10)                     | Inclusion lookup                   | ICD-10                                                     | `INPAT`, `OUTPAT`                                        | [any-code](#any-code), [match-prefix](#match-prefix), [cause-symptom](#cause-symptom), [mode](#mode), [mark-no-code](#mark-no-code) |
| [HD\_ICD\_9](#hd_icd_9)                       | Inclusion lookup                   | ICD-9                                                      | `INPAT`, `OUTPAT`                                        | [any-code](#any-code), [match-prefix](#match-prefix), [mode](#mode), [mark-no-code](#mark-no-code)                                  |
| [HD\_ICD\_8](#hd_icd_8)                       | Inclusion lookup                   | ICD-8                                                      | `INPAT`, `OUTPAT`                                        | [any-code](#any-code), [match-prefix](#match-prefix), [mode](#mode), [mark-no-code](#mark-no-code)                                  |
| [HD\_ICD\_10\_EXCL](#hd_icd_-10-_excl)        | Exclusion lookup                   | ICD-10                                                     | `INPAT`, `OUTPAT`                                        | [any-code](#any-code), [match-prefix](#match-prefix), [cause-symptom](#cause-symptom)                                               |
| [HD\_ICD\_9\_EXCL](#hd_icd_-9-_excl)          | Exclusion lookup                   | ICD-9                                                      | `INPAT`, `OUTPAT`                                        | [any-code](#any-code), [match-prefix](#match-prefix)                                                                                |
| [HD\_ICD\_8\_EXCL](#hd_icd_-8-_excl)          | Exclusion lookup                   | ICD-8                                                      | `INPAT`, `OUTPAT`                                        | [any-code](#any-code), [match-prefix](#match-prefix)                                                                                |
| [COD\_MAINONLY](#cod_mainonly)                | Diagnosis selection hint           | –                                                          | `DEATH`                                                  | –                                                                                                                                   |
| [COD\_ICD\_10](#cod_icd_10)                   | Inclusion lookup                   | ICD-10                                                     | `DEATH`                                                  | [any-code](#any-code), [match-prefix](#match-prefix), [mark-no-code](#mark-no-code)                                                 |
| [COD\_ICD\_9](#cod_icd_9)                     | Inclusion lookup                   | ICD-9                                                      | `DEATH`                                                  | [any-code](#any-code), [match-prefix](#match-prefix), [mark-no-code](#mark-no-code)                                                 |
| [COD\_ICD\_8](#cod_icd_8)                     | Inclusion lookup                   | ICD-8                                                      | `DEATH`                                                  | [any-code](#any-code), [match-prefix](#match-prefix), [mark-no-code](#mark-no-code)                                                 |
| [COD\_ICD\_10\_EXCL](#cod_icd_-10-_excl)      | Exclusion lookup                   | ICD-10                                                     | `DEATH`                                                  | [any-code](#any-code), [match-prefix](#match-prefix), [mark-no-code](#mark-no-code)                                                 |
| [COD\_ICD\_9\_EXCL](#hd_icd_-9-_excl)         | Exclusion lookup                   | ICD-9                                                      | `DEATH`                                                  | [any-code](#any-code), [match-prefix](#match-prefix)                                                                                |
| [COD\_ICD\_8\_EXCL](#hd_icd_-8-_excl)         | Exclusion lookup                   | ICD-8                                                      | `DEATH`                                                  | [any-code](#any-code), [match-prefix](#match-prefix)                                                                                |
| [OPER\_NOM](#oper_nom)                        | Inclusion lookup                   | NOMESCO                                                    | `OPER_IN`, `OPER_OUT`                                    | [any-code](#any-code)                                                                                                               |
| [OPER\_HL](#oper_hl)                          | Inclusion lookup                   | Finnish hospital league                                    | `OPER_IN`, `OPER_OUT`                                    | [any-code](#any-code)                                                                                                               |
| [OPER\_HP1](#oper_hp1)                        | Inclusion lookup                   | Demanding heart patient, old codes                         | `OPER_IN`, `OPER_OUT`                                    | [any-code](#any-code)                                                                                                               |
| [OPER\_HP2](#oper_hp2)                        | Inclusion lookup                   | Demanding heart patient, new codes                         | `OPER_IN`, `OPER_OUT`                                    | [any-code](#any-code)                                                                                                               |
| [KELA\_REIMB](#kela_reimb)                    | Inclusion lookup                   | KELA reimbursement code                                    | `REIMB`                                                  | [any-code](#any-code)                                                                                                               |
| [KELA\_REIMB\_ICD](#kela_reimb_icd)           | Inclusion lookup                   | ICD-10, ICD-9                                              | `REIMB`                                                  | [any-code](#any-code), [match-prefix](#match-prefix)                                                                                |
| [KELA\_ATC\_NEEDOTHER](#kela_atc_needother)   | Additional requirement hint        | –                                                          | `PURCH`                                                  | –                                                                                                                                   |
| [KELA\_ATC](#kela_atc)                        | Inclusion lookup                   | ATC                                                        | `PURCH`                                                  | [any-code](#any-code), [match-prefix](#match-prefix)                                                                                |
| [KELA\_VNRO\_NEEDOTHER](#kela_vnro_needother) | Additional requirement hint        | –                                                          | `PURCH`                                                  | –                                                                                                                                   |
| [KELA\_VNRO](#kela_vnro)                      | Inclusion lookup                   | VNRO                                                       | `PURCH`                                                  | –                                                                                                                                   |
| [CANC\_TOPO](#canc_topo)                      | Inclusion lookup                   | ICD-O-3 topography                                         | `CANC`                                                   | [any-code](#any-code), [match-prefix](#match-prefix), [canc-all](#canc-all), [mark-no-code](#mark-no-code)                          |
| [CANC\_TOPO\_EXCL](#canc_topo_excl)           | Exclusion lookup                   | ICD-O-3 topography                                         | `CANC`                                                   | [any-code](#any-code), [match-prefix](#match-prefix), [canc-all](#canc-all)                                                         |
| [CANC\_MORPH](#canc_morph)                    | Inclusion lookup                   | ICD-O-3 morphology                                         | `CANC`                                                   | [any-code](#any-code), [match-prefix](#match-prefix), [canc-all](#canc-all)                                                         |
| [CANC\_MORPH\_EXCL](#canc_morph_excl)         | Exclusion lookup                   | ICD-O-3 morphology                                         | `CANC`                                                   | [any-code](#any-code), [match-prefix](#match-prefix), [canc-all](#canc-all)                                                         |
| [CANC\_BEHAV](#canc_behav)                    | Inclusion lookup                   | ICD-O-3 behavior                                           | `CANC`                                                   | [any-code](#any-code), [match-prefix](#match-prefix), [canc-all](#canc-all)                                                         |

## Event Rules

### **OUTPAT\_ICD**

Consider events where:

* `SOURCE`: is `PRIM_OUT`
* and `CATEGORY`: contains `ICD`
* and `CODE1`: matches the `OUTPAT_ICD` regex

### **OUTPAT\_OPER**

Consider events where:

* `SOURCE`: is `PRIM_OUT`
* and `CATEGORY`: starts with `OP`
* and the `OUTPAT_OPER` regex matches `CODE1`

### **HD\_MAINONLY**

Values

* `YES`: only look at events with `CATEGORY`: `0` for the rules of `HD_ICD_10`, `HD_ICD_9`, `HD_ICD_8`, `HD_ICD_10_EXCL`, `HD_ICD_9_EXCL` and `HD_ICD_8_EXCL`
* `NA`: (nothing to filter)

This rule states to look only into the main diagnosis for hospital discharge events (as opposed to side diagnoses, where `CATEGORY` is not `0`).

### **HD\_ICD\_10\_ATC**

Consider events where:

* `SOURCE`: is `INPAT` or `OUTPAT`
* and the `HD_ICD_10_ATC` regex matches `CODE3`

This rule must be applied by looking for events that match both this rule and the `HD_ICD_10` rule at the same time.

For example, an endpoint definition with `HD_ICD_10` = `E610` and `HD_ICD_10_ATC` = `ANY` will match an event that has:

* `SOURCE`: `INPAT` or `OUTPAT`
* and `ICDVER`: 10
* and `HD_ICD_10` regex matches `CODE1` or `CODE2`
* and any code in `CODE3` (but there must be a code there, it cannot be empty)

### **HD\_ICD\_10**

Consider events where:

* `SOURCE`: is `INPAT` or `OUTPAT`
* and the `HD_ICD_10` regex matches `CODE1` or `CODE2`
* and `ICDVER`: is 10

### **HD\_ICD\_9**

Consider events where:

* `SOURCE`: is `INPAT` or `OUTPAT`
* and the `HD_ICD_9` regex matches `CODE1` or `CODE2`
* and `ICDVER`: is 9

### **HD\_ICD\_8**

Consider events where:

* `SOURCE`: is `INPAT` or `OUTPAT`
* and the `HD_ICD_8` regex matches `CODE1` or `CODE2`
* and `ICDVER`: is 8

### **HD\_ICD\_10\_EXCL**

Discard events where:

* `SOURCE`: is `INPAT` or `OUTPAT`
* and the `HD_ICD_10_EXCL` regex matches `CODE1` or `CODE2`
* and `ICDVER`: is 10

### **HD\_ICD\_9\_EXCL**

Discard events where:

* `SOURCE`: is `INPAT` or `OUTPAT`
* and the `HD_ICD_9_EXCL` regex matches `CODE1` or `CODE2`
* and `ICDVER`: is 9

### **HD\_ICD\_8\_EXCL**

Discard events where:

* `SOURCE`: is `INPAT` or `OUTPAT`
* and the `HD_ICD_8_EXCL` regex matches `CODE1` or `CODE2`
* and `ICDVER`: is 8

### **COD\_MAINONLY**

Values

* `YES`: only look at events with `CATEGORY`: `U` or `I` for the rules of `COD_ICD_10`, `COD_ICD_9`, `COD_ICD_8`, `COD_ICD_10_EXCL`, `COD_ICD_9_EXCL`, and `COD_ICD_8_EXCL`
* `NA`: (nothing to filter)

This rule states to look only into the main diagnosis for cause of death events (`CATEGORY`: `U` for underlying and `I` for immediate cause of death, as opposed to contributing cause of death `CATEGORY`: starts with `c`).

### **COD\_ICD\_10**

Consider events where:

* `SOURCE`: is `DEATH`
* and the `COD_ICD_10` regex matches `CODE1` or `CODE2`
* and the `ICDVER`: is 10

### **COD\_ICD\_9**

Consider events where:

* `SOURCE`: is `DEATH`
* and the `COD_ICD_9` regex matches `CODE1` or `CODE2`
* and the `ICDVER`: is 9

### **COD\_ICD\_8**

Consider events where:

* `SOURCE`: is `DEATH`
* and the `COD_ICD_8` regex matches `CODE1` or `CODE2`
* and the `ICDVER`: is 8

### **COD\_ICD\_10\_EXCL**

Discard events where:

* `SOURCE`: is `DEATH`
* and the `COD_ICD_10_EXCL` regex matches `CODE1` or `CODE2`
* and `ICDVER`: is 10

### **COD\_ICD\_9\_EXCL**

Discard events where:

* `SOURCE`: is `DEATH`
* and the `COD_ICD_9_EXCL` regex matches `CODE1` or `CODE2`
* and `ICDVER`: is 9

### **COD\_ICD\_8\_EXCL**

Discard events where:

* `SOURCE`: is `DEATH`
* and the `COD_ICD_8_EXCL` regex matches `CODE1` or `CODE2`
* and `ICDVER`: is 8

### **OPER\_NOM**

Consider events where:

* `SOURCE`: is `OPER_IN` or `OPER_OUT`
* and the `OPER_NOM` regex matches `CODE1`
* and `CATEGORY`: contains `NOM`

### **OPER\_HL**

Consider events where:

* `SOURCE`: is `OPER_IN` or `OPER_OUT`
* and the `OPER_HL` regex matches `CODE1`
* and `CATEGORY`: contains `FHL`

### **OPER\_HP1**

Consider events where:

* `SOURCE`: is `OPER_IN` or `OPER_OUT`
* and the `OPER_HP1` regex matches `CODE1`
* and `CATEGORY`: contains `HPO`

### **OPER\_HP2**

Consider events where:

* `SOURCE`: is `OPER_IN` or `OPER_OUT`
* and the `OPER_HP1` regex matches `CODE1`
* and `CATEGORY`: contains `HPN`

### **KELA\_REIMB**

Consider events where:

* `SOURCE`: is `REIMB`
* and `KELA_REIMB` regex matches `CODE1`

### **KELA\_REIMB\_ICD**

Consider events where:

* `SOURCE`: is `REIMB`
* and `KELA_REIMB_ICD` regex matches `CODE2`

This rule must be applied by looking for events that match both this rule and the `KELA_REIMB` rule at the same time.

### **KELA\_ATC\_NEEDOTHER**

Values

* `NA`: 3 events or more of the `KELA_ATC` rule are needed to attribute the endpoint
* `SINGLE_OK`: 1 event or more of `KELA_ATC` rule are needed to attribute the endpoint
* `YES`: the `KELA_ATC` rule is not sufficient by itself, another rule must be matching to attribute the endpoint

This rule sets additional requirements on the `KELA_ATC` rule.

### **KELA\_ATC**

Consider events where:

* `SOURCE`: is `PURCH`
* and `KELA_ATC` regex matches `CODE1`

### **KELA\_VNRO**

This rule is not used.

### **KELA\_VNRO\_NEEDOTHER**

This rule is not used.

### **CANC\_TOPO**

Consider events where:

* `SOURCE`: is `CANC`
* and the `CANC_TOPO` regex matches `CODE1`

### **CANC\_TOPO\_EXCL**

Discard events where:

* `SOURCE`: is `CANC`
* and the `CANC_TOPO_EXCL` regex matches `CODE1`

### **CANC\_MORPH**

Consider events where:

* `SOURCE`: is `CANC`
* and the `CANC_MORPH` regex matches `CODE2`

### **CANC\_MORPH\_EXCL**

Discard events where:

* `SOURCE`: is `CANC`
* and the `CANC_MORPH_EXCL` regex matches `CODE2`

### **CANC\_BEHAV**

Consider events where:

* `SOURCE`: is `CANC`
* and the `CANC_TOPO` regex matches `CODE3`

### **INCLUDE**

Value

* other endpoint names, separated by `|`

Attribute the current endpoint to an individual if it has at least one of the endpoints in `INCLUDE`.

### **PRE\_CONDITIONS**

Value

* condition on `EVENT_AGE` or `EVENT_YEAR`
* `EMERG`: (unused, nothing to do)
* `NA`: (nothing to do)

Discard events **not** matching `PRE_CONDITIONS` from the list of candidate events.

This rule usually applies a filter on age or year at the event. It filters out some events from the existing list of candidate events.

### **CONDITIONS**

An individual must fit the `CONDITIONS` rule to be attributed the endpoint.

### **SEX**

Values

* `1`: only keep males
* `2`: only keep females
* `NA`: (nothing to filter, the endpoint is not sex-specific)

This filter should be applied as the last filter.

## Extra rules

### **any-code**

When the rule is written as `ANY`, then the event must have a code for the given rule, but the actual code has no importance.

This rule is useful when matching an event against multiple rules, for example:

* `HD_ICD_10`: `K250`
* and `HD_ICD_10_ATC`: `ANY`

This example requires that an event has any ATC code and at the same time has the ICD-10 code `K250`. The endpoint will match drug-induced events since it requires there is an ATC code, but the actual ATC code doesn't matter.

### **match-prefix**

The rule must match starting from the beginning of its value, in regex terms it means the rule value has to be prepended with a `^`. This modified rule is then used as a regex.

For example, a match-prefix rule with a value of `I21` matches `I2100` but doesn't match `AEI21`.

### **cause-symptom**

An ampersand `&` between two codes indicates a cause-symptom pair (specific to Finnish ICD-10). In that case, both the cause code and the symptom code must be found in the same event.

For example, `HD_ICD_10` = `M07&L405` will match an event that has both `M07` (in `CODE1` or `CODE2`) and `L405` (in `CODE1` or `CODE2`).

### **mode**

A rule value starting with a percent sign `%` indicates a mode rule. The event will be considered only if the code is the most common amongst its sibling ICD codes for an individual.

For example `%J450` would match events of an individual only if `J450` is the most common code among the codes starting with `J45`.

### **canc-all**

When an endpoint has multiple cancer rules (from `CANC_TOPO`, `CANC_TOPO_EXCL`, `CANC_MORPH`, `CANC_MORPH_EXCL`, `CANC_BEHAV`) then it is not enough to match only one of them: all cancer rules that are defined must be satisfied by the event.

### mark-no-code

The mark `$!$` is used to state that someone has checked and there is no suitable code for this endpoint in a given registry.

For example, if an endpoint has `HD_ICD_9` with a value of `$!$` then it means someone has gone through the whole Finnish ICD-9 and reported that there is no code that can be from that.

## Gotchas

* One single event can span multiple rows in the detailed longitudinal data files: events are unique by (`FINNGENID`, `SOURCE`, `INDEX`), but not by row. Rows with the same values for `FINNGENID`, `SOURCE`, `INDEX` must be looked at as one single event when performing look-ups.
* The ICD-10, ICD-9 and ICD-8 used by FinnGen are specific Finnish versions which differ slightly from the international ones. This means for example that the ICD-10 found in FinnGen data are a bit different from the WHO ICD-10 or the US ICD-10-CM.
* In the FinnGen data, the ICD-O-3 is used for cancer codes.
* The dot `.` and the comma `,` are not present in the codes in the FinnGen files, e.g. `J45.1` would be `J451` in the endpoint definition file and the detailed longitudinal file.
* For rules that are regexes: a dot `.` means "any character" and not an actual dot.
* Endpoints with specific control rules are not documented here (yet!)

## Appendix: list of registries

| Name in FinnGen data (`SOURCE`) | Registry description                     |
| ------------------------------- | ---------------------------------------- |
| `CANC`                          | Cancer                                   |
| `DEATH`                         | Cause of death                           |
| `INPAT`                         | HILMO inpatient                          |
| `OPER_IN`                       | HILMO inpatient (operations)             |
| `OUTPAT`                        | HILMO specialist outpatient              |
| `OPER_OUT`                      | HILMO specialist outpatient (operations) |
| `PRIM_OUT`                      | AvoHILMO: primary care outpatient        |
| `PURCH`                         | Kela drug purchase                       |
| `REIMB`                         | Kela drug reimbursement                  |

## Appendix: coding systems and translations

* [Where to find the translation file for phenotype data](/finngen-data-specifics/finnish-health-registers-and-medical-coding/where-to-find-the-translation-file-for-phenotype-data), documentation from the FinnGen Handbook
* [Finnish ICD-10 book](http://urn.fi/URN:NBN:fi-fe201205085423)
* [Finnish ICD-9 book](http://urn.fi/URN:NBN:fi-fe201701261356)
* [Finnish ICD-8 book](http://urn.fi/URN:NBN:fi-fe201710058910)
* [ICD-O-3 book](https://apps.who.int/iris/bitstream/handle/10665/96612/9789241548496_eng.pdf)
* [NOMESCO book](http://norden.diva-portal.org/smash/get/diva2:968721/FULLTEXT01.pdf)
* ‌[ATC codes](https://www.whocc.no/atc_ddd_index/)
* ‌[ICPC2 codes](https://www.who.int/standards/classifications/other-classifications/international-classification-of-primary-care)

#### Glossary <a href="#orga79a9a9" id="orga79a9a9"></a>

* Kela: the Social Insurance Institution of Finland
* HILMO: Finnish care registers for health care


# Location of Endpoint Quality Control Report

The **quality control report** describes the steps that have been made to ensure the quality of released data. Endpoint quality control report, changelog and corrected\_endpoints file of DF8 can be found [here](https://www.finngen.fi/fi/endpoint-quality-control-data-freeze-8). Changelog for other data freezes can be found [here](https://www.finngen.fi/en/researchers/clinical-endpoints).

**Endpoint quality control** is divided into **two sections**:

* Protocol development that uses old data, but new endpoint definition files and updated Endpointer program
* One that takes place before each release to ensure released data quality. The process has been designed and performed in collaboration between clinical and register teams.

![](https://3072695768-files.gitbook.io/~/files/v0/b/gitbook-x-prod.appspot.com/o/spaces%2F-MhYL0UTLjqsuIdK0SSO%2Fuploads%2Fgit-blob-5efd52591c35a652d861a139d73f524374b34b1a%2Fimage%20\(420\).png?alt=media)

**Changelog file**: compares previous data freeze (eg.DF7) and current data freeze (eg. DF8) endpoint definition files in order to track changes in endpoint definitions. It contains deleted, new and modified endpoints. The changelog file can be found [here](https://www.finngen.fi/en/researchers/clinical-endpoints) and [here](https://www.finngen.fi/fi/endpoint-quality-control-data-freeze-8).

**Corrected endpoints file:** The file contains all corrections for data freeze DF8, including corrected endpoint definitions or corrections in Endpointter script. The file can be found [here](https://www.finngen.fi/fi/endpoint-quality-control-data-freeze-8).


# Creating a User-defined Endpoint(s)

The FinnGen core analysis provides endpoints that cover all branches of the ICD tree. However, there might be specific additional endpoints you are interested in or different definitions of existing endpoints.

We provide a variety of tools you can use to make your own user-defined endpoints. Red data (individual-level data) rights are needed to have access to the tools and data. For more about red data see "[What do we mean by "red" and "green" data?](/working-in-the-sandbox/what-do-we-mean-by-red-and-green-data)", "[Do I need "red" or "green" data access?](/faq/about-finngen-access-and-accounts/do-i-need-red-or-green-data-access)", and "[If I already have green data access, how do I apply for red?](/faq/about-finngen-access-and-accounts/if-i-already-have-green-data-access-how-do-i-apply-for-red)".

An example workflow may help to choose between the tools, plan your own workflow, and get started with endpoint defining. For instructions of the most common analyses researchers are conducting with FinnGen data in FinnGen Sandbox see [General workflows for the most common analyses](/working-in-the-sandbox/general-workflows-for-the-most-common-analyses).

Tools for creating and visualizing a user-defined Endpoint(s) (Tools usage needs [red data access](/faq/about-finngen-access-and-accounts/do-i-need-red-or-green-data-access)).

<table><thead><tr><th width="157">Tool</th><th width="222">Description</th><th width="95">GUI tool</th><th>coding skills needed</th></tr></thead><tbody><tr><td><a href="/working-in-the-sandbox/which-tools-are-available/atlas/detailed-guide/how-to-define-a-cohort-in-atlas">Atlas</a></td><td>Creating user-defined cohorts and visualization</td><td>Yes</td><td>No</td></tr><tr><td><a href="/working-in-the-sandbox/which-tools-are-available/genotype-browser">Genome Browser</a></td><td>Examine &#x26; export variant-level information</td><td>Yes</td><td>No</td></tr><tr><td><a href="/working-in-the-sandbox/which-tools-are-available/cohort-operations-tool-co">Cohort Operations</a></td><td>Operate cohorts made with other tools (e.g. Atlas, Genotype Browser, R), export cohorts, visualization</td><td>Yes</td><td>No</td></tr><tr><td><a href="/working-in-the-sandbox/which-tools-are-available/trajectory-visualization-tool-tvt">TVT</a></td><td>Visualize large numbers of longitudinal cases with glyphs of user-defined conditions, export</td><td>Yes</td><td>No</td></tr><tr><td><a href="/working-in-the-sandbox/working-with-phenotype-data/how-to-check-case-counts-from-the-data">RStudio</a></td><td>Interactive coding using R language</td><td>No</td><td>Yes</td></tr><tr><td><a href="/working-in-the-sandbox/which-tools-are-available/anaconda-python-module-with-ready-set-of-scientific-packages">Jupyter </a>(Python)</td><td>Interactive coding using Python language</td><td>No</td><td>Yes</td></tr><tr><td><a href="/working-in-the-sandbox/which-tools-are-available/miscellaneous-helper-scripts-tools">Code Snippets</a></td><td>BigQuery connections using R and Python language</td><td>No</td><td>Yes</td></tr></tbody></table>

For more tools available in the Sandbox see [Which tools are available](/working-in-the-sandbox/which-tools-are-available).


# Requesting a User-defined Endpoint to be included in Core Analysis

If your user-defined endpoint provides interesting new results not seen in the core GWAS analyses, you may wish to have it become part of the core GWAS analysis with each data freeze (*to note*: all core analysis results can be viewed on [PheWeb](/working-outside-the-sandbox/link-to-how-to-use-pheweb) and include useful cross-linking to other FinnGen and external results).

### Conditions that must be met before an endpoint can become a core endpoint

* it must be available in [userresults.finngen.fi](https://userresults.finngen.fi/). This is done by using Custom GWAS command line CLI.
* it should have < 90% case overlap with existing core endpoints. **Tip!** For a fast and easy check of the overlap percentage use the [Cohort Operations](/working-in-the-sandbox/which-tools-are-available/cohort-operations-tool-co/launch-custom-gwas-with-co) tool.
* it should provide novel genetic results
* it should be definable within the grammar used to specify FinnGen Endpoints

### **Guidelines for endpoint creation:**

* Endpoint should be created/modified by the user using [Atlas tool](/working-in-the-sandbox/which-tools-are-available/atlas) in Sandbox or by another appropriate method
* The newly created/modified endpoint should be run by user using [Custom GWAS tool](/working-in-the-sandbox/which-tools-are-available/untitled) in Sandbox or another appropriate method
* The newly created/modified endpoint request and link to Custom GWAS results need to be submitted via [online form](https://elomake.helsinki.fi/lomakkeet/114892/lomake.html) to Endpoint team. In cases where the online form is not sufficient you can also contact the Endpoint team by sending email to: <finngen-endpoints@helsinki.fi>.


# Complete follow-up time of the FinnGen registries – primary endpoint data

Follow-up times of the [Finnish registers](/finngen-data-specifics/finnish-health-registers-and-medical-coding/finnish-health-registers) varies. Some registers begin as early as in the 1950-60s ([Cancer register](/finngen-data-specifics/red-library-data-individual-level-data/what-phenotype-files-are-available-in-sandbox-1/registers-in-the-detailed-longitudinal-data#finnish-cancer-registry) 1953; [KELA drug reimbursement register](/finngen-data-specifics/red-library-data-individual-level-data/what-phenotype-files-are-available-in-sandbox-1/registers-in-the-detailed-longitudinal-data#drug-purchase-data-the-social-insurance-institution-of-finland-kela-kansanelaekelaitos) 1964; [inpatient Hilmo register](/finngen-data-specifics/red-library-data-individual-level-data/what-phenotype-files-are-available-in-sandbox-1/registers-in-the-detailed-longitudinal-data#hilmo-care-register-for-health-care) 1969; [Causes-of-death register](/finngen-data-specifics/red-library-data-individual-level-data/what-phenotype-files-are-available-in-sandbox-1/registers-in-the-detailed-longitudinal-data#cause-of-death-data-statistics-finland) 1969) and follow-up may continue even until the current year (Hilmo register, [primary care register](/finngen-data-specifics/red-library-data-individual-level-data/what-phenotype-files-are-available-in-sandbox-1/registers-in-the-detailed-longitudinal-data#avohilmo-register-of-primary-health-care-visits)), whereas the records in other registers begin later (e.g. primary care register 2011) and follow-up may end even a couple of years before the current date (cancer register, cause-of-death register).

The section [Finnish health registers](/finngen-data-specifics/finnish-health-registers-and-medical-coding/finnish-health-registers) shows the **beginning of follow-up** for each register; and the section [detailed longitudinal data](/finngen-data-specifics/red-library-data-individual-level-data/what-phenotype-files-are-available-in-sandbox-1/detailed-longitudinal-data) explains the registers with detailed longitudinal and endpoint data.

It has been decided to keep the follow-up of each register as far as it is received from the registry. This allows analyses to use the most recent data from each register, which is important, for example, for COVID-19 research.

However, one “**common follow-up end date**” (FU\_*END*\_DATE) for all registers in the endpoint data is needed to be able to calculate the pre-calculated variable ENDPOINT\_AGE for each endpoint in the [Endpoint data](/finngen-data-specifics/red-library-data-individual-level-data/what-phenotype-files-are-available-in-sandbox-1/endpoint-and-endpoint-longitudinal-data) file.

**Common follow-up end** date is specific to each data freeze. It is decided based on the additional follow-up years in the register data that are received by the register team.

#### **Follow-up end times of the registers belonging to the detailed longitudinal data file, and common follow-up end date used for the endpoind data**:

| Data Freeze | Hilmo      | Avohilmo   | Kela drug purchases | Kela drug reimbursements | Death        | Cancer     | Common FU\_END\_DATE |
| ----------- | ---------- | ---------- | ------------------- | ------------------------ | ------------ | ---------- | -------------------- |
| DF14        | 30.9.2025  | 30.9.2025  | 11.8.2025           | 31.12.2024               | 31.12.2024   | 31.12.2024 | 9/2025               |
| DF13        | 31.8.2024  | 31.8.2024  | 30.6.2024           | 31.12.2023               | 31.12.2023   | 31.12.2022 | 31.8.2024            |
| DF12        | 28.4.2023  | 28.4.2023  | 31.12.2022          | 31.12.2022               | 31.12.2021   | 31.12.2021 | 28.4.2023            |
| DF11        | 02.11.2022 | 02.11.2022 | 31.12.2021          | 31.12.2021               | 31.12.2020   | 31.12.2021 | 02.11.2022           |
| DF10        | 31.12.2021 | 31.12.2021 | 31.12.2021          | 31.12.2021               | 31.12.2020   | 31.12.2019 | 31.12.2021           |
| DF9         | 11.10.2021 | 11.10.2021 | 31.12.2020          | 31.12.2020               | 31.12.2019   | 31.12.2019 | 11.10.2021           |
| DF8         | 24.3.2021  | 24.3.2021  | 31.12.2019          | 31.12.2019               | 31.12.2019   | 31.12.2018 | 31.12.2019           |
| DF7         | 31.12.2019 | 31.12.2020 | 31.12.2019          | 31.12.2019               | 31.12.2018   | 31.12.2018 | 31.12.2019           |
| DF6         | 31.12.2018 | 31.12.2018 | 31.12.2019          | 31.12.2019               | 31.12.2018   | 31.12.2018 | 31.12.2019           |
| DF5         | 31.12.2018 | 31.12.2018 | 31.12.2018          | 31.12.2017               | not included | 31.12.2017 |                      |
| DF4         | 31.12.2017 | 31.12.2017 | 31.12.2017          | 31.12.2018               | not included | 31.12.2017 |                      |

**In the endpoint data the ENDPOINT\_AGE variable contains the age for each individual at:**

**Cases:**

* first EVENT\_AGE

**Controls:**

* FU\_END\_DATE (DF9: 11.10.21, Common follow-up end data, =latest registry follow-up end date)

**OR**

* Age at death (if deceased - and even if emigrated at some point)

**OR**

* Age at emigration (if moved abroad and not deceased).

In the DF9 endpoint data, this common follow-up end date has been decided to be 11.10.21, which is the “latest follow-up end date” available in any of the registries (in this case the Hilmo and Avohilmo registries) in the endpoint data (Figure 1).

Keeping the follow-up as far back as possible in each registry leads to some features/biases that are good to keep in mind. For example, the follow-up in the “causes-of-death registry” ends on 31.12.2019 in DF9, which is long before the end of follow-up in the Hilmo and Avohilmo registries (11.10.2021). Thus, we cannot be sure that an individual is still alive in 2021, if there aren’t any records after 2019 in any other registers (Figure 1).

![](https://3072695768-files.gitbook.io/~/files/v0/b/gitbook-x-prod.appspot.com/o/spaces%2F-MhYL0UTLjqsuIdK0SSO%2Fuploads%2Fgit-blob-efc635e88cf245be0f6ad33ec7a786e3fd5cbad8%2Fkuva%20\(67\).png?alt=media)

It is important to take into account the difference in follow-up beginning and end dates of registers. This is the case for, for example, survival analyses where the goal is to investigate the survival or disease progression of an individual by using information from several different registers (eg. using endpoint data; many endpoints are created by combining information from several registries).

Take a look at the section [Truncated endpoint data for survival analysis](/finngen-data-specifics/endpoints/complete-follow-up-time-of-the-finngen-registries-primary-endpoint-data/survival-analysis-using-the-truncated-endpoint-file-secondary-endpoint-data) for information about the additional endpoint data to be used for the survival analysis.

**Related FAQs:**

[**I found BL\_AGE after FU\_END\_AGE in endpoint data, how is it possible?**](/faq/about-endpoints/i-found-bl_age-after-fu_end_age-in-the-endpoint-data-how-is-it-possible)

[**Why individuals who are not dead have death age in endpoint data?**](/faq/about-endpoints/why-individuals-who-are-not-dead-have-death-age-in-endpoint-data)

[**I found EVENT\_AGE after FU\_END\_AGE in endpoint data, how is it possible?**](/faq/about-endpoints/i-found-event_age-after-fu_end_age-in-endpoint-data-how-is-it-possible)


# Survival analysis using the truncated endpoint file – secondary endpoint data

In addition to the regular endpoint files of DF9 (and subsequent data freezes), the register team will release a separate file for survival analyses. It is the so-called “truncated” endpoint datafile in which the common follow-up end date is 31.12.2019 (for DF9) for all of the registers (Figure 2). This is the last date to which the follow-up reaches in all registers included in the [detailed longitudinal](/finngen-data-specifics/red-library-data-individual-level-data/what-phenotype-files-are-available-in-sandbox-1/detailed-longitudinal-data) and [endpoint data](/finngen-data-specifics/red-library-data-individual-level-data/what-phenotype-files-are-available-in-sandbox-1/endpoint-and-endpoint-longitudinal-data). When the follow-up is truncated for all registers to end at the same time, it becomes possible to see the complete disease status of the individuals even in the latest follow-up years.

![](https://3072695768-files.gitbook.io/~/files/v0/b/gitbook-x-prod.appspot.com/o/spaces%2F-MhYL0UTLjqsuIdK0SSO%2Fuploads%2Fgit-blob-6a72b142f5d9aea30309e1963726af1b39dc6749%2Fkuva%20\(56\).png?alt=media)

### **Survival analysis using the truncated endpoint file**

Each endpoint in the [Endpoint data](/finngen-data-specifics/red-library-data-individual-level-data/what-phenotype-files-are-available-in-sandbox-1/endpoint-and-endpoint-longitudinal-data) contains the variable “ENDPOINT\_AGE", which is a pre-calculated variable that contains individuals' ages at:

**Cases:** first recorded EVENT\_AGE

**Controls:**

\- [FU\_END\_DATE](/finngen-data-specifics/endpoints/complete-follow-up-time-of-the-finngen-registries-primary-endpoint-data) (DF9: 31.12.2019, in the truncated endpoint file)

**OR**

\- Age at death (if deceased – and even if moved abroad at some point)

**OR**

\- Age at emigration (if moved abroad, and not deceased).

Survival analysis can be run using the variables BL\_AGE (age when each individual has entered the study, i.e. donated DNA sample), ENDPOINT\_AGE and a 1/0 indicator for the ENDPOINT.

BL\_AGE is the age at which each individual has entered the study. Most of the individuals have joined the study after all follow-up register data has been made available (Figure 2). The exceptions are the [primary care register Avohilmo](/finngen-data-specifics/red-library-data-individual-level-data/what-phenotype-files-are-available-in-sandbox-1/registers-in-the-detailed-longitudinal-data#avohilmo-register-of-primary-health-care-visits) (with the beginning of the follow-up in 2011), the [specialist outpatient Hilmo registry](/finngen-data-specifics/red-library-data-individual-level-data/what-phenotype-files-are-available-in-sandbox-1/registers-in-the-detailed-longitudinal-data#hilmo-care-register-for-health-care) (1998) and the [Kela drug purchase register](/finngen-data-specifics/red-library-data-individual-level-data/what-phenotype-files-are-available-in-sandbox-1/registers-in-the-detailed-longitudinal-data#drug-purchase-data-the-social-insurance-institution-of-finland-kela-kansanelaekelaitos) (1995), for which the follow-up may have begun after the individual joined the study. This small bias, that a small portion of the events go undetected (false negative) or that their first recorded EVENT\_AGE is too large (such as for type 1 diabetes), has to be accepted for these registers.

![Figure 2](https://3072695768-files.gitbook.io/~/files/v0/b/gitbook-x-prod.appspot.com/o/spaces%2F-MhYL0UTLjqsuIdK0SSO%2Fuploads%2Fgit-blob-87ec697c1da7cd1cfaeba01b538cce2f8f3cdb9a%2Fkuva%20\(24\).png?alt=media)

Survival analysis can be run using the truncated endpoint file, as in the example below:

**1. With age as the time scale**

`cox<- coxph(Surv(BL_AGE,DEATH_AGE,DEATH)~strata(GENDER) +CANC+INV_HDL+SMOKING+PREVAL_DIAB+factor(BMI_factor),data=foo)`

**2. With follow-up time scale**

DEATH\_AGEDIFF <- DEATH\_AGE-BL\_AGE

`cox<- coxph(Surv(DEATH_AGEDIFF,DEATH)~strata(GENDER)+ BL_AGE+CANC+INV_HDL+SMOKING+PREVAL_DIAB+factor(BMI_factor),data=foo)`


# Biobanks in Finland

Finland's Biobank Act was instated in 2013, and the current legislation requires official registration of all biobanks. Currently there are ten registered biobanks in Finland, eight of which are members of the Finnish Biobank Cooperative [FINBB](https://finbb.fi/en/).

FINBB's mission is to make Finnish health and biomedical research more competitive by providing researchers centralized access to the collections and services of the Finnish biobanks and their background organizations.

### **FINBB Member Biobanks**

* Six regional hospital biobanks are owned by the respective wellbeing services counties and universities:
  * [Auria Biobank](https://www.auria.fi/biopankki/en/)
  * [Northern Finland Biobank Borealis](https://oys.fi/en/front-page/for-researchers/biobank-borealis-of-northern-finland/)
  * [Central Finland Biobank](https://www.hyvaks.fi/sairaala-nova/biopankki)
  * [Biobank of Eastern Finland](https://www.uef.fi/en/service/biobank-of-eastern-finland)
  * [Helsinki Biobank](https://www.helsinginbiopankki.fi/en/front-page)
  * [Finnish Clinical Biobank Tampere](https://www.pirha.fi/ammattilaiselle/tampereen-biopankki)
* Two cohort biobanks, one local and one nation-wide:
  * [Arctic Biobank at University of Oulu](https://www.oulu.fi/en/university/faculties-and-units/faculty-medicine/northern-finland-birth-cohorts-and-arctic-biobank/arctic-biobank)
  * [THL Biobank](https://thl.fi/en/our-services/thl-biobank1)

Additionally, the [Blood Service Biobank](https://www.veripalvelu.fi/en/biobank/) and [FHRB Biobank](https://www.hematologinenbiopankki.fi) belong to the FINBB network.

Finnish biobanks belong to the European Biobank Infrastructure Network [BBMRI-ERIC](https://www.bbmri-eric.eu/). Finnish Biobanks participate actively in implementation of the [BBMRI-ERIC](https://www.bbmri-eric.eu/) Work Program with specific emphasis on IT, Quality, and Ethical and Legal Issues. FINBB is actively promoting the centralized access tool [Fingenious](https://site.fingenious.fi/en/) on a national level.

Take a look at the sections [Minimum phenotype data](/finngen-data-specifics/red-library-data-individual-level-data/what-phenotype-files-are-available-in-sandbox-1/minimum-and-minimum-longitudinal-data), [Extracting minimum phenotype data per biobank ](/finngen-data-specifics/red-library-data-individual-level-data/what-phenotype-files-are-available-in-sandbox-1/minumum-extended-phenotype-data/extraction-of-finngen-minimum-data-set-information-per-biobank)and [DNA isolation protocols per biobank](/finngen-data-specifics/red-library-data-individual-level-data/what-phenotype-files-are-available-in-sandbox-1/minumum-extended-phenotype-data/dna-isolation-protocols-per-biobank) for more information about biobank data within FinnGen.


# Specifics of the Blood Service Biobank data

Due to specific blood donation eligibility criteria, Blood Service Biobank participants share distinct features.

The Blood donor biobank consists of a selected group of individuals with an active and long-standing history of blood donation. Eligibility criteria for blood donation exclude individuals with certain medical conditions, such as severe cardiovascular conditions, cancer and epilepsy, and also require specific health parameters, such as a minimum haemoglobin level. Some conditions that disqualify individuals from donating blood have a well-established genetic basis. For example, HLA gene variants are associated with type 1 diabetes (T1D)<sup>1</sup> and certain autoimmune diseases<sup>2–4</sup>.

The combination of blood donation eligibility criteria, the generally healthier lifestyle of blood donors, and self-selection due to temporary illnesses (e.g., the common cold) contributes to a well-known phenomenon called the *Healthy Donor Effect* (HDE). HDE results in a lower morbidity and mortality rates among blood donors compared to the general population. In addition, recruitment strategies based on blood group antigens can lead to the depletion or enrichment of certain blood group antigens that are associated with specific diseases<sup>5</sup>.

Therefore, GWAS comparing Blood Service Biobank blood donors (N=53,688) with a control population (N=228,060) shows a negative genetic correlation in blood donors in several disease endpoints, extending beyond the conditions excluded by donation criteria<sup>6</sup>. <https://userresults-old.finngen.fi/pheno/BloodDonor>

Despite of the protective genetic factors, blood donors in the Blood Service Biobank also carry disease-associated genetic variants at frequencies similar to the FinnGen cohort<sup>8</sup>, indicating that blood donor-based biobank is suitable for finding samples from individuals carrying disease-associated variants. Furthermore, the relatively high degree of first-degree consanguinity in the Blood Service Biobank⁷ makes it suitable for trio-based and linkage studies.

While a biobank based on blood donors can be a valuable resource for biomedical research, careful consideration is necessary to control for potential confounding factors, especially when using blood donors exclusively as a control group. It is important to remember that blood donors represent a health-selected population, and in some cases, selection is also influenced by blood type. These selection biases must be appropriately accounted for in research to avoid misleading conclusions.

1\. Hu, X. *et al.* Additive and interaction effects at three amino acid positions in HLA-DQ and HLA-DR molecules drive type 1 diabetes risk. *Nat. Genet.* 47, 898–905 (2015).

2\. De Silvestri, A. *et al.* The Involvement of HLA Class II Alleles in Multiple Sclerosis: A Systematic Review with Meta-analysis. *Dis. Markers* 2019, 1409069 (2019).

3\. Dendrou, C. A., Petersen, J., Rossjohn, J. & Fugger, L. HLA variation and disease. *Nat. Rev. Immunol.* 18, 325–339 (2018).

4\. Ritari, J., Koskela, S., Hyvärinen, K., FinnGen & Partanen, J. HLA-disease association and pleiotropy landscape in over 235,000 Finns. *Hum. Immunol.* 83, 391–398 (2022).

5\. Dahlén, T., Clements, M., Zhao, J., Olsson, M. L. & Edgren, G. An agnostic study of associations between ABO and RhD blood group and phenome-wide disease risk. *Elife* 10, (2021).

6\. Jonna Clancy, Jarkko Toivonen, J. L. et al. Genome-Wide Association Study Identifies Protective Genetic Factors in Active Blood Donors Against Multiple Diseases. *Prepr. Eur. J. Hum. Genet.* (2025).

7\. Kurki, M. I. *et al.* FinnGen: Unique genetic insights from combining isolated population and national health register data. *medRxiv* 2022.03.03.22271360 (2022) doi:10.1101/2022.03.03.22271360.

8\. Clancy, J. *et al.* Blood donor biobank as a resource in personalised biomedical genetic research. *Eur. J. Hum. Genet.* (2024) doi:10.1038/s41431-023-01528-0.


# Red Library Data (individual level data)

## Types of red data available in FinnGen

Clinical codes are recorded in nationwide registries which are harmonized together into one table in FinnGen

<figure><img src="https://3072695768-files.gitbook.io/~/files/v0/b/gitbook-x-prod.appspot.com/o/spaces%2F-MhYL0UTLjqsuIdK0SSO%2Fuploads%2Fgit-blob-c626af0fcfc4dd753da891c16db65a165bfcb6e9%2Fkuva%20(11).png?alt=media" alt=""><figcaption></figcaption></figure>

### Code sets in detailed longitudinal data

* **Kela (Social insurance institution)**
  * The REIMB/KELA codes are unique to Finland - these are longterm reimbursement codes for a class of drugs and imply a robust review of diagnosis. For example, KELA code 307 provides reimbursement for donepezil, galantamine, memantine and rivastigmine and is granted only after review of physician
    * ATC – drug identifiers
    * REIMB – drug reimbursements
    * VNRO – drug product number including dosage and number in package
* **Hilmo/Hospital codes**
  * Diagnosis in ICD-10, ICD-9 and ICD-8
  * Procedures (Nomesco, Finnish Hospital league\*, Heart patient\*\*)
* **Cancer registry**
  * ICD-O-3 (topology, morphology, behavior codes, OBS. no specific information on gradus or metastatic spread)
* **Avohilmo**
  * Diagnosis in ICD-10 and nurse codes ICPC2
  * Procedures (SPAT, Nomesco)
  * Dental codes

\*) Finnish specific procedure codes, \*\*) Finnish specific demanding heart patient procedure code

<figure><img src="https://3072695768-files.gitbook.io/~/files/v0/b/gitbook-x-prod.appspot.com/o/spaces%2F-MhYL0UTLjqsuIdK0SSO%2Fuploads%2Fgit-blob-1ed7996806aa04c9e5c8ac91632cc7772946b47c%2Fkuva%20(6).png?alt=media" alt=""><figcaption><p>Code sets in detailed longitudinal data</p></figcaption></figure>

### Additional registries

* **Vaccination registry** from primary health care (vaccination, type of vaccination, disease, method and site, approx. date, contains also COVID vaccination)
* **Kidney registry** (only dialysis/transplantation patients, set of diagnosis codes)
* **Digital and population data services agency, birth registry** (reproductive history data - detailed information on births in FinnGen participants)
* **Visual impairment registry** (data on legally blind patients: diagnosis, visual acuity, diameter of visual field, homonyme hemianopsia)
* **Cancer screening registries** (cervical and breast)
* **Parental causes of death** (ICD-8/9/10)
* **Infectious diseases** (COVID positive patients and their treatment)
* **Congenital malformations** (congenital chromosomal and structural anomalies, congenital hypothyroidism, teratomas)
* **Service sector data** (service sector (e.g. elderly home), contact type, specialty, hospital type, urgency, professional type, Kela drug reimbursement costs, Kela drug reimbursement category)

### Minimum phenotype data (comes with the samples from the biobanks)

* Age
* smoking status (yes/no, current/former/never, current/occasional/quitter/former/never)
* BMI

## Genetic data (germline)

* GWAS array genotypes (500,000)
  * 420,000 samples genotyped with ThermoFisher Axiom custom arrays (v1 and V2). The following numbers are from v2:
    * Total of 664,510 markers including:
      * About 500,000 core GWAS markers
      * 116,000 coding variants enriched in Finland
      * \>10,000 specific markers for the HLA/KIR region
      * about 15,000 ClinVar variants
      * about 4,600 pharmacogenomic variants
      * 57,000 selected markers of special interest for partners
  * 70-80,000 samples genotypes with various other GWAS arrays (Legacy genotypes)
* Imputed genotypes (520,000)
  * \~21,3M variants per individual
  * imputed using Finnish specific WGS reference panel of \~9000 individuals

**In this section we will share the following:**

[Genotype data](/finngen-data-specifics/red-library-data-individual-level-data/genotype-data)

[Phenotype data](/finngen-data-specifics/red-library-data-individual-level-data/what-phenotype-files-are-available-in-sandbox-1)

[Expansion Area 3 (EA3) studies](/finngen-data-specifics/expansion-area-3-ea3-projects)


# Genotype data

The FinnGen data focuses on ascertaining up to 500,000 samples where along with the available health registry data, the genotype data can further enrich this ascertainment: giving analysts a scientific field that will satiate anyone's scientific curiosities.

![Enriching the samples](https://3072695768-files.gitbook.io/~/files/v0/b/gitbook-x-prod.appspot.com/o/spaces%2F-MhYL0UTLjqsuIdK0SSO%2Fuploads%2Fgit-blob-d41ecb80be751a02418013f3421200240e2ee9ba%2FScreen%20Shot%202021-09-26%20at%208.44.16%20PM.png?alt=media\&token=bef64856-3708-467f-9dc2-670dc641ccd4)

### How genotype data is ascertained and processed

* [**Genotype Arrays Used**](/finngen-data-specifics/red-library-data-individual-level-data/genotype-data/affymetrix-chip-and-its-design)
* [**Imputation Panel**](/finngen-data-specifics/red-library-data-individual-level-data/genotype-data/imputation-panel)
* [**Genome build used in FinnGen**](/finngen-data-specifics/red-library-data-individual-level-data/genotype-data/human-genome-build-we-use-and-how-do-we-report-genotypes)
* [**Genotype Data Processing Flow**](/finngen-data-specifics/red-library-data-individual-level-data/genotype-data/description-of-how-the-data-is-processed-in-refinery)
* [**Genotype Files in Sandbox**](/finngen-data-specifics/red-library-data-individual-level-data/genotype-data/types-of-genotype-files-available)


# Genotype Arrays Used

The genotyping of new samples and some of the legacy cohort samples was performed on a FinnGen ThermoFisher Axiom custom arrays (v1 and v2) at the ThermoFisher genotyping service facility in San Diego.

![](https://3072695768-files.gitbook.io/~/files/v0/b/gitbook-x-prod.appspot.com/o/spaces%2F-MhYL0UTLjqsuIdK0SSO%2Fuploads%2Fgit-blob-b43601cd56b313bd169f5cb1f760be71214ef796%2Fimage%20\(468\).png?alt=media)

### Array Content

The FinnGen ThermoFisher Axiom custom arrays v2 array consists of 736,145 probes for 655,973 genetic markers. In addition to the core GWAS markers (about 500,000), the array also contains 116,402 coding variants which are enriched in Finland; 10,800 specific markers for the HLA/KIR (Human leucocyte antigen / killer cell immunoglobulin-like receptors) region; 14,900 [ClinVar](https://ncbi.nlm.nih.gov/clinvar/) variants; 4,600 pharmacogenomic variants; and 57,000 selected markers that were of special interest to our [partners](https://www.finngen.fi/en/partners).

The marker content of the [FinnGen ThermoFisher Axiom custom array v2 ](https://www.finngen.fi/en/researchers/genotyping)(current version) can be [downloaded from here](https://www.dropbox.com/s/n8srnyy547resrq/finngen2_proposal_5_5_2019.tsv?dl=0). The content for v1 is [downloadable from here](https://www.dropbox.com/s/9cf656gz2tdxd66/finngen1_variants_rsid.txt.gz?dl=0).

The legacy samples have previously been genotyped over the years using various generations of Illumina GWAS arrays (*below*). All GWAS data is imputed against a Finnish population-specific[ ](/finngen-data-specifics/red-library-data-individual-level-data/genotype-data/imputation-panel)[imputation panel](/finngen-data-specifics/red-library-data-individual-level-data/genotype-data/imputation-panel).

Some preference was given for testing coding variants directly on the chip vs. imputing them.

### FinnGen Legacy chips

* DS1\_BOTNIA\_Dgi
* Affymetrix\_250KNsp\_250KSty
* DS2\_BOTNIA\_T2dgo
* lllumina\_HumanOmni2.5-4v1\_B\_SNV\_array
* DS3\_COROGENE\_Sanger
* Illumina Human610-Quadv1\_B
* DS4\_FINRISK\_Corogene
* Human610-Quadv1\_B
* DS5\_FINRISK\_Engage
* HumanCoreExome-12v1-0\_A
* DS6\_FINRISK\_FR02\_Broad
* GSAMD-24v1-0\_20011747\_A1
* DS7\_FINRISK\_FR12
* Illumina\_HumanCoreExome-24-v1.1
* DS8\_FINRISK\_Finpcga
* Illumina\_HumanCoreExome-12v1.1a
* DS9\_FINRISK\_Mrpred
* Illumina\_HumanCoreExome-24\_v1.0
* DS10\_FINRISK\_Palotie
* HumanCoreExome-12v1-1\_A
* DS11\_FINRISK\_PredictCVD\_COROGENE\_Tarto
* HumanOmniExpress-12v1\_A
* DS12\_FINRISK\_Summit
* HumanOmniExpress-12v1\_H
* DS13\_FINRISK\_Bf
* Illumina\_HumanCoreExome-24\_v1.0
* DS14\_GENERISK
* lllumina\_HumanCoreExome-24v1-0\_A
* DS15\_H2000\_Broad
* Broad\_GWAS\_supplemental\_15061359\_A1
* DS16\_H2000\_Fimm
* Illumina\_HumanCoreExome-24v1-1\_A
* DS17\_H2000\_Genmets
* Human610-Quadv1\_B
* DS18\_MIGRAINE\_1
* PsychChip\_15048346\_B-\_24
* DS19\_MIGRAINE\_2
* HumanCoreExome-12v1-0\_A
* DS20\_SUPER\_1
* GSAMD-24v1-0\_20011747\_A1
* DS21\_SUPER\_2
* GSAMD-24v1-0\_20011747\_A1
* DS22\_TWINS\_1
* Illumina Human670/Human610
* DS23\_TWINS\_2
* IlluminaCoreExome
* DS24\_SUPER\_3
* GSAMD-24v1-0\_20011747\_A1
* DS25\_BOTNIA\_Regeneron
* GSA-24v1-0\_A1


# Legacy cohorts and chips

FinnGen study **utilizes biobank samples** consisting of **two entities:**

* **Prospective samples**

Prospective samples are mainly collected by hospital biobanks. A request to donate a prospective sample for biobank research can come in a variety of ways. During a hospital visit, a patient can be asked whether he or she would be interested in giving a biobank consent and donating their sample.

* **Legacy samples**

Legacy samples are older sample cohorts that have been collected for research prior to when the Finnish Biobank Act came into effect (September 2013) and the start of FinnGen (August 2017). These cohorts have then later been transferred to various Finnish biobanks. Below you can find the legacy sample cohorts accessed in FinnGen.&#x20;

**Note** that some legacy cohorts were genotyped on the FinnGen array, but for others we used "legacy genotypes" — chip data from biobank samples genotyped before FinnGen began. These samples were genotyped over time using various generations of Illumina and Affymetrix GWAS arrays. Below you can find various the legacy chips (and respective cohorts) used in FinnGen.&#x20;

<table data-header-hidden><thead><tr><th width="150">Cohort</th><th width="150">Biobank</th><th>Comment</th></tr></thead><tbody><tr><td><strong>Legacy cohort</strong></td><td><strong>Biobank</strong></td><td><strong>Description /sample size in whole cohort</strong></td></tr><tr><td>Auria legacy</td><td>Auria</td><td>Biobank samples collected in Auria in 2016 (before FinnGen started)</td></tr><tr><td>Auria legacy, <a href="https://pohjanmaanhyvinvointi.fi/palvelumme/terveys-ja-sairaanhoitopalvelut/terveyskeskusten-palvelut/pohjanmaan-diabetesyksikko/direva-diabetesrekisteri/">Direva</a></td><td>Auria</td><td>DIREVA is the diabetes register of the Vaasa hospital district, which is carried out through the co-operation with Lund University in Malmö, Botnia Study and University of Helsinki. 7000 participants. Blood/DNA samples available from all participants.</td></tr><tr><td><a href="https://thl.fi/en/our-services/thl-biobank1/thl-biobank-datasets-and-samples">Botnia</a></td><td>THL</td><td>Ongoing study since 1990 investigating diabetes risk factors To date, >15 000 participants from 1400 families. DNA available from all participants, also serum, plasma, cell and RNA samples, from subset, genotype data available from 12720, WES from 395 participants. Botnia data includes; Botnia DGI affy, Botnia T2DGo and Botnia-regeneon.</td></tr><tr><td><a href="https://thl.fi/en/web/thl-biobank/for-researchers/sample-collections/corogene-study">Corogene</a></td><td>THL</td><td>Collected at the Helsinki University hospital during 2006-2008 from patients with coronary artery disease (CAD) and other related heart diseases to understand risk factors of heart diseases. DNA and genotype data available from 4890 participants.</td></tr><tr><td>Eastern Finland legacy</td><td>Eastern Finland</td><td>KBCP (breast cancer patients, ~400), Nomod (Nordic modic project, back surgery patients, ~60), NPH (normal pressure hydrocephalus cohort, patients, relatives and contorls ~950), L-MCI (neuro/alzheimer patients, ~705)</td></tr><tr><td>Eastern Finland legacy (Adgen)</td><td>Eastern Finland</td><td>A multidisciplinary study, which focuses on identification of novel Alzheimer’s disease (AD)-associated genes and pathways using existing clinical cohorts from Eastern and Northern Finland ~1700 patients fulfilling the NINCDS-ADRDA criteria for probable AD and ~1700 cognitively healthy controls from Eastern and Northern Finland.</td></tr><tr><td>Eastern Finland legacy (Aneurysm)</td><td>Eastern Finland</td><td>-</td></tr><tr><td>Eastern Finland legacy (NOMOD, IIH S100B)</td><td>Eatern Finland</td><td>NOMOD (Nordic modic project, back surgery patients ~370), IIH patients (~70), S100B biomarker study (acute head injury study, n~50)</td></tr><tr><td><a href="https://thl.fi/en/our-services/thl-biobank1/thl-biobank-datasets-and-samples">FinHealth</a></td><td>THL</td><td>A population survey study by the Finnish Institute for Health and Welfare (THL), producing up-to-date information on health, health behavior, functional capacity and well-being of adults residing in Finland. 6650 participants with DNA, serum and plasma, genotype data available from 6250 participants. NMR metabolomics from 5290.</td></tr><tr><td><a href="https://www.finhit.fi/">FinHIT</a></td><td>THL</td><td>Fin-HIT is a prospective school-based cohort study including approximately 11,000 Finnish adolescents aged 9–12 years at enrolment across densely populated areas of Finland. The cohort will be followed at least for 25 years. The objectives of the study are to explore non-conventional determinants for weight and weight gain; to investigate etiology of weight-related health outcomes; and to understand underlying molecular mechanisms involved in the origin and development of obesity and related health outcomes.</td></tr><tr><td><a href="https://thl.fi/fi/web/thl-biopankki/tietoa-thl-biopankista/thl-biopankin-naytekokoelmat/finnish-ipf-tutkimus-biopankissa">FinIPF</a></td><td>THL</td><td>A nationwide registry study of idiopathic pulmonary fibrosis (IPF) patients. The aim is to monitor the prevalence, treatment, pathophysiology and prognosis IPF patients. From 2017, FinnishIPF study has collected biobank samples from 206 participants, which form the FinnIPF subcohort</td></tr><tr><td><a href="https://thl.fi/en/web/thlfi-en/research-and-development/research-and-projects/the-national-finrisk-study">FINRISKI</a></td><td>THL</td><td>Cross-sectional population surveys carried out every 5 years by THL, to assess health status, risk factors of chronic diseases (e.g. CVD, diabetes, obesity, cancer) and health behavior among the working age population, in Finland. Total of 41 000 participants; Currently available: DNA 36 300, plasma/ serum 27 200 and genotype data from 31 300 participants. WES 12160, WGS 4460, NMR metabolomics 27 160. PBMC available from 2700 participants. RNA from subsets. Transcriptomics and other omics 500+500.Telomers 4070.</td></tr><tr><td><a href="https://thl.fi/en/web/thl-biobank/for-researchers/sample-collections/generisk-study">GENERISK</a></td><td>THL</td><td>A prospective study investigating genetic risk factors of cardiovascular diseases and utilizing genetic information in preventing diseases. Conducted in years 2015-2018 in several different areas of Finland. Participant follow-up is still ongoing. DNA, serum and plasma available from 7300 participants, genotype data available from 7270 participants.</td></tr><tr><td><a href="https://thl.fi/en/web/thlfi-en/research-and-development/research-and-projects/health-2000-2011">Health 2000-2011</a></td><td>THL</td><td>A comprehensive combination of health interview and health examination survey carried out by THL in 2000-2001 with a follow-up in 2011. Investigating public health problems and population’s functional capacity in working-aged and the aged population in Finland. 8 611 individual participants, DNA, serum and plasma available from all participants (baseline and follow-up), genotype data available from 7700, WES 4960 , WGS 205 NMR metabolomics 10290, Telomers 7404</td></tr><tr><td><a href="https://thl.fi/en/web/thl-biobank/for-researchers/sample-collections/helsinki-heart-study">Helsinki Heart Study</a></td><td>Helsinki BB</td><td>Five-year trial, collected between 1981-90, testing the efficacy of simultaneously elevating serum levels of HDL cholesterol and lowering levels of non-HDL cholesterol with gemfibrozil in reducing the risk of coronary heart disease in asymptomatic men. Blood/DNA and serum available from 4000 participants, genotype data currently available from 2000 participants.</td></tr><tr><td><a href="http://www.finnanest.fi/files/korhonen_finnaki.pdf">HKI BB Finnaki</a></td><td>Helsinki BB</td><td>Studying incidence, risk factors and outcome of acute kidney injury (AKI) in Finnish Intensive Care Units. 2546 participants. DNA/genotype data available from all participants.</td></tr><tr><td>Kuusamo 2011</td><td>THL</td><td></td></tr><tr><td><a href="https://thl.fi/en/our-services/thl-biobank1/thl-biobank-datasets-and-samples">Migraine</a></td><td>THL</td><td>The Migraine Family Study by FIMM/UH is focused on identifying variation in genes that are associated with migraine, headache-related symptoms and chronic disease risk factors. Collected since 1992 and ongoing. DNA available from 9450 participants, genotype data available from 8470 participants, WES 490, WGS 625.</td></tr><tr><td><a href="https://www.oulu.fi/en/university/faculties-and-units/faculty-medicine/northern-finland-birth-cohorts-and-arctic-biobank/research-program-health-and-well-being">Northern Finland Birth Cohort</a> 1935, 1945, 1966, 1986</td><td>Arctic Biobank</td><td>The University of Oulu has collected several extensive population survey data sets, such as the Northern Finland Birth Cohorts NFBC1966 and NFBC1986. Blood/DNA samples available from 14 400 participants, genotype data from 10 000 participants.</td></tr><tr><td><a href="https://thl.fi/en/our-services/thl-biobank1/thl-biobank-datasets-and-samples">SETTI (ATBC)</a></td><td>THL</td><td>The Alpha-Tocopherol, Beta-Carotene (ATBC) Lung Cancer Prevention Study (1984-1993) of male smokers was a randomized, double-blinded, placebo-controlled trial testing whether alpha-tocopherol and/or beta-carotene supplements can reduce the incidence of lung and other cancers. Serum 29 000, DNA samples available from 20 000 participants, genotype data from 4000.</td></tr><tr><td><a href="https://thl.fi/en/our-services/thl-biobank1/thl-biobank-datasets-and-samples">SUPER</a></td><td>THL</td><td>The Study is a part of the International Stanley Global Neuropsychiatric Genomics Initiative, seeking to expand knowledge of genetic diversity and biological background in schizophrenia, bipolar disorder, and autism. DNA, serum and plasma available from 9350 and genotype data from 9025 participants.</td></tr><tr><td><a href="https://thl.fi/en/our-services/thl-biobank1/thl-biobank-datasets-and-samples">THL Diabetes studies</a></td><td>THL</td><td>THL has collected samples and data from diabetics and their family members in several sub-studies between 1986 and 2013. The focus has been on the genetic background and environmental triggers of diabetes in Finland. Size: DNA from 13 600 participants, plasma, serum and cell samples from subsets; genotype data available from 9080 participants.</td></tr><tr><td><a href="https://thl.fi/en/our-services/thl-biobank1/thl-biobank-datasets-and-samples">THL Psychiatric Family Collections (FSZ and BPD)</a></td><td>THL</td><td>The THL Psychiatric Family Collections include families ascertained for schizophrenia, schizoaffective disorder and bipolar spectrum disorder. The objective of the study is to identify the genetic risk factors for serious psychiatric disorders in Finnish families.</td></tr><tr><td><a href="https://thl.fi/en/our-services/thl-biobank1/thl-biobank-datasets-and-samples">Twin study</a></td><td>THL</td><td>Population-based study of UH collected from Finnish twins and their family members. Based on three longitudinal questionnaire data-sets from >14 000 participants. The collection has been expanded with follow-up sub-studies involving samples and data. DNA available from 14200 participants, genotype data available from 14100 participants.</td></tr></tbody></table>

### FinnGen Legacy cohorts and chips

<table><thead><tr><th width="311">Dataset</th><th>Chip type</th></tr></thead><tbody><tr><td>DS1_BOTNIA_Dgi</td><td>Affymetrix_250KNsp_250KSty</td></tr><tr><td>DS2_BOTNIA_T2dgo</td><td>lllumina_HumanOmni2.5-4v1_B_SNV_array</td></tr><tr><td>DS3_COROGENE_Sanger</td><td>Illumina Human610-Quadv1_B</td></tr><tr><td>DS4_FINRISK_Corogene</td><td>Human610-Quadv1_B</td></tr><tr><td>DS5_FINRISK_Engage</td><td>HumanCoreExome-12v1-0_A</td></tr><tr><td>DS6_FINRISK_FR02_Broad</td><td>GSAMD-24v1-0_20011747_A1</td></tr><tr><td>DS7_FINRISK_FR12</td><td>Illumina_HumanCoreExome-24-v1.1</td></tr><tr><td>DS8_FINRISK_Finpcga</td><td>Illumina_HumanCoreExome-12v1.1a</td></tr><tr><td>DS9_FINRISK_Mrpred</td><td>Illumina_HumanCoreExome-24_v1.0</td></tr><tr><td>DS10_FINRISK_Palotie</td><td>HumanCoreExome-12v1-1_A</td></tr><tr><td>DS11_FINRISK_PredictCVD_COROGENE_Tarto</td><td>HumanOmniExpress-12v1_A</td></tr><tr><td>DS12_FINRISK_Summit</td><td>HumanOmniExpress-12v1_H</td></tr><tr><td>DS13_FINRISK_Bf</td><td>Illumina_HumanCoreExome-24_v1.0</td></tr><tr><td>DS14_GENERISK</td><td>lllumina_HumanCoreExome-24v1-0_A</td></tr><tr><td>DS15_H2000_Broad</td><td>Broad_GWAS_supplemental_15061359_A1</td></tr><tr><td>DS16_H2000_Fimm</td><td>Illumina_HumanCoreExome-24v1-1_A</td></tr><tr><td>DS17_H2000_Genmets</td><td>Human610-Quadv1_B</td></tr><tr><td>DS18_MIGRAINE_1</td><td>PsychChip_15048346_B-_24</td></tr><tr><td>DS19_MIGRAINE_2</td><td>HumanCoreExome-12v1-0_A</td></tr><tr><td>DS20_SUPER_1</td><td>GSAMD-24v1-0_20011747_A1</td></tr><tr><td>DS21_SUPER_2</td><td>GSAMD-24v1-0_20011747_A1</td></tr><tr><td>DS22_TWINS_1</td><td>Illumina Human670/Human610</td></tr><tr><td>DS23_TWINS_2</td><td>IlluminaCoreExome</td></tr><tr><td>DS24_SUPER_3</td><td>GSAMD-24v1-0_20011747_A1</td></tr><tr><td>DS25_BOTNIA_Regeneron</td><td>GSA-24v1-0_A1</td></tr><tr><td>DS26_DIREVA</td><td>InfiniumCoreExome-24v1-1</td></tr><tr><td>DS27_NFBC66</td><td>Illumina HumanCNV370DUO Analysis BeadChip</td></tr><tr><td>DS28_NFBC86</td><td>HumanOmniExpressExome v 1.2</td></tr></tbody></table>


# Imputation Panel

## History of the SiSu Project

[The International Sequencing Initiative Suomi (SISu)](http://sisuproject.fi) Project was launched in 2011 to collect and facilitate a wider usage of Finnish whole-genome sequencing (WGS) and whole-exome sequencing (WES) datasets.

For the longest time, Finnish (and Finnophile) geneticists have been using SISu as a resource for referring to Finnish specific allele frequencies and understanding Finnish genetic architecture.

## How do we use the SiSu imputation panel?

The convenience of using FinnGen data is that the genotype data is imputed against a [Finnish specific (Sisu) imputation panel.](https://thl.fi/en/web/thl-biobank/for-researchers/sample-collections/thl-biobank-imputation-reference-panel)

The Sisu imputation panels used are described in the subsections of both

* [Sisu v4 (as of August 2021)](/finngen-data-specifics/red-library-data-individual-level-data/genotype-data/imputation-panel/sisu-v4-reference-panel) and
* [Sisu v3 (as of FinnGen R2)](/finngen-data-specifics/red-library-data-individual-level-data/genotype-data/imputation-panel/sisu-v3-reference-panel) reference panel sections


# Sisu v4.2 reference panel

At present, the Sisu v4.2 reference panel is used as the imputation panel in FinnGen.

| **Summary:**                     | Descriptors            |
| -------------------------------- | ---------------------- |
| Total number of samples:         | 8,554                  |
| Total number of variant alleles: | 21,331,644             |
| Chromosomes:                     | chrs 1-22, chrX        |
| Variants included:               | SNV and InDel variants |
| Panel file format:               | BREF, phased VCF       |
| Reference genome build:          | GRCh38                 |
| Docs last updated:               | 28.05.2024             |

SISu v4.2 reference panel contains samples from the following cohorts and sample collections: FINRISK, METSIM, Corogene, Finnish Dyslipidemia Study and Eastern Finland biobank samples. Genotype, sample and variant-wise quality control (QC) filtering procedures were applied in an *iterative manner^* on the high-coverage WGS (hcWGS) data using the Hail framework v0.1 and v0.2 (unless mentioned otherwise). We separately did genotype- and variant-wise QC for nonLCR variants, LCR SNVs and LCR InDels of autosomal chromosomes. Then a final genotype- and variant-wise QC were applied to all pre-filtered autosomal variants. We separately did genotype- and variant-wise QC for XPAR and nonXPAR variants of chromosome X.

## 1. Genotype-wise QC

**Non LCR variants and LCR SNVs of all autosomal chromosomes:**

genotypes were marked as ‘*missing*’ (`./.`) if:

* Sequencing read depth (DP) > 200; or
* PHRED-scaled genotype quality (GQ) < 20; or
* The proportion of informative reads (total allele depth \[AD] / depth \[DP]) < 0.9; or
* For homozygous reference calls (0/0): the proportion of informative reads (reference AD / DP) < 0.9;
* For heterozygous variant calls (0/1): the proportion of informative reads (alternative AD / DP) was not within the interval 0.2-0.8 or the normalized PHRED-scaled probability of the reference genotype (pl\[0]) < 20;
* For homozygous variant calls (1/1): the proportion of informative reads (alternative AD / DP) < 0.9 or pl\[0] < 20;

**LCR InDels of all autosomal chromosomes:**

genotypes were marked as ‘*missing*’ (`./.`) if:

* Sequencing read depth (DP) was not within the interval 5-200; or
* PHRED-scaled genotype quality (GQ) < 30; or
* The proportion of informative reads (total allele depth \[AD] / depth \[DP]) < 0.9; or
* For homozygous reference calls (0/0): the proportion of informative reads (reference AD / DP) < 0.9;
* For heterozygous variant calls (0/1): the proportion of informative reads (alternative AD / DP) was not within the interval 0.3-0.7 or the normalized PHRED-scaled probability of the reference genotype (pl\[0]) < 50;
* For homozygous variant calls (1/1): the proportion of informative reads (alternative AD / DP) < 0.9 or pl\[0] < 50;

After separately applied genotype-wise QC and variant-wise QC for nonLCR variants, LCR SNVs and LCR InDels, we applied a final genotype-wise and variant-wise QC for all pre-filtered autosomal variants: genotypes were set as missing based on the following thresholds (For variant-wise QC threshold, please check the Variant-wise QC part).

**Pre-filtered variants of all autosomal chromosomes:**

* Sequencing read depth (DP) > 200; or
* PHRED-scaled genotype quality (GQ) < 20; or
* The proportion of informative reads (total allele depth \[AD] / depth \[DP]) < 0.9; or
* For homozygous reference calls (0/0): the proportion of informative reads (reference AD / DP) < 0.9;
* For heterozygous variant calls (0/1): the proportion of informative reads (alternative AD / DP) was not within the interval 0.2-0.8 or the normalized PHRED-scaled probability of the reference genotype (pl\[0]) < 20;
* For homozygous variant calls (1/1): the proportion of informative reads (alternative AD / DP) < 0.9 or pl\[0] < 20;

**Chromosome X:**

**nonXPAR region:**

genotypes were marked as ‘*missing*’ (`./.`) if:

* DP > 200; or
* GQ < 10 for male individuals; or
* GQ < 20 for female individuals; or
* The proportion of informative reads (total allele depth \[AD] / depth \[DP]) < 0.9; or
* For homozygous reference calls (0/0): the proportion of informative reads (reference AD / DP) < 0.9;
* For heterozygous variant calls (0/1): the proportion of informative reads (alternative AD / DP) was not within the interval 0.2-0.8 or the normalized PHRED-scaled probability of the reference genotype (pl\[0]) < 20 or was male;
* For homozygous variant calls (1/1): the proportion of informative reads (alternative AD / DP) < 0.9 or pl\[0] < 20

**XPAR region:**

genotypes were marked as ‘*missing*’ (`./.`) if:

* DP > 200; or
* GQ < 20; or
* The proportion of informative reads (total allele depth \[AD] / depth \[DP]) < 0.9; or
* For homozygous reference calls (0/0): the proportion of informative reads (reference AD / DP) < 0.9;
* For heterozygous variant calls (0/1): the proportion of informative reads (alternative AD / DP) was not within the interval 0.2-0.8 or the normalized PHRED-scaled probability of the reference genotype (pl\[0]) < 20;
* For homozygous variant calls (1/1): the proportion of informative reads (alternative AD / DP) < 0.9 or pl\[0] < 20;

## 2. Sample-wise QC/filtering

To include only high-quality samples, the following sample-wise QC criteria were first applied to bi-allelic variants on autosomes (excluding variants in low-complexity regions).

**Variants were preserved (for calculating sample-wise metrics) if:**

* variant filter was PASS; and
* quality by depth (QD) for SNPs was > 2 and for indels > 3; and
* allele count (AC) was ≥ 3; and
* Variant-wise call-rate (CR) > 90%; and
* Hardy-Weinberg Equilibrium p-value (pHWE) > 1e-9.

Outlier samples with CR <= 95% or deviating more than ±3SD were identified from sample-wise QC metrics (nSNP, rHetHomVar, rTiTv, rInsertionDeletion, dpStDev) and excluded (Table 1). In addition, a number of low Indel quality individuals were removed from the data to fix observed batch-effects (Outliers with Indels showing obviously lower value of rInsertionDeletion).

In order to identify closely-related samples, the data was further LD-pruned with window size 1M and r2 = 0.2 by first keeping only bi-allelic variants and excluding variants on high-LD regions, pHWE <= 1e-9, minor allele frequency (MAF) < 0.05 and variant-wise CR <= 90%. With Plink v2.0 [KING](https://www.cog-genomics.org/plink/2.0/distance#make_king) method, closely-related individuals (kinship coefficient < 0.177) were identified from the LD-pruned data and excluded.

Then, the top 20 principal components (PCs) were computed and outlier samples to be excluded were identified based on these 20 PCs. Next, individuals with **ambiguous sex1** (samples with imputed sex conflicting with biobank reported sex or for which imputed sex is 'ambiguous') were identified and excluded. Furthermore, we additionally removed 53 samples as they were obvious QC outliers considering the following sample-wise metrics (rInsertionDeletion < 0.985, nSingleton>50000).

Outlier samples listed in the above steps were excluded from the data before applying variant-wise QC/filtering)

**Table 1.** Definition of terms

| **Name**           | **Type** | **Description**                                          |
| ------------------ | -------- | -------------------------------------------------------- |
| callRate           | Double   | Fraction of genotypes called                             |
| nHomRef            | Int      | Number of homozygous reference genotypes                 |
| nHet               | Int      | Number of heterozygous genotypes                         |
| nHomVar            | Int      | Number of homozygous alternate genotypes                 |
| nCalled            | Int      | Sum of nHomRef + nHet + nHomVar                          |
| nNotCalled         | Int      | Number of uncalled genotypes                             |
| nSNP               | Int      | Number of SNP alternate alleles                          |
| nInsertion         | Int      | Number of insertion alternate alleles                    |
| nDeletion          | Int      | Number of deletion alternate alleles                     |
| nSingleton         | Int      | Number of private alleles                                |
| nTransition        | Int      | Number of transition (A-G, C-T) alternate alleles        |
| nTransversion      | Int      | Number of transversion alternate alleles                 |
| nNonRef            | Int      | Sum of nHet and nHomVar                                  |
| rTiTv              | Double   | Transition/Transversion ratio                            |
| rHetHomVar         | Double   | Het/HomVar genotype ratio                                |
| rInsertionDeletion | Double   | Insertion/Deletion ratio                                 |
| dpMean             | Double   | Depth mean across all genotypes                          |
| dpStDev            | Double   | Depth standard deviation across all genotypes            |
| gqMean             | Double   | The average genotype quality across all genotypes        |
| gqStDev            | Double   | Genotype quality standard deviation across all genotypes |

## 3. Variant-wise QC/filtering

Mitochondrial and chromosome Y variants were excluded. In order to preserve multiallelic sites, they were decomposed into bi-allelic format.

**Autosomal chromosomes:**

Genotypes were set as missing based on the above-mentioned (step 1 Genotype-wise QC/filtering) thresholds.

Next, for nonLCR variants, they were preserved, if:

* Variant filter was PASS; and
* QD for SNPs > 2 and for InDels > 4; and
* AC > 0; and
* Variant-wise CR > 90%; and
* pHWE > 1e-9.

For LCR SNVs, they were preserved, if:

* Variant filter was PASS; and
* QD for SNPs > 6; and
* AC > 0; and
* Variant-wise CR > 95%; and
* pHWE > 1e-9.

For LCR InDels, they were preserved, if:

* Variant filter was PASS; and
* QD for InDels > 4; and
* AC > 0; and
* Variant-wise CR > 95%; and
* pHWE > 1e-9.

After separately processed nonLCR variants, LCR SNVs and LCR InDels, for all pre-filtered autosomal variants: genotypes were set as missing based on the above-mentioned (step 1 Genotype-wise QC) thresholds.

Next, for all pre-filtered autosomal variants, they were preserved, if:

* Variant filter was PASS; and
* QD for SNPs > 2 and for InDels > 4; and
* AC > 0; and
* Variant-wise CR > 90%; and
* pHWE > 1e-9.

**Chromosomes X:**

Genotypes were set as missing based on the above-mentioned (step 1 Genotype-wise QC/filtering) thresholds.

Next, for nonXPAR variants, they were preserved, if:

* Variant filter was PASS; and
* QD for SNPs > 2 and for indels > 4; and
* AC > 0; and
* Variant-wise CR > 90%; and
* pHWE > 1e-9 (pHWE was calculated by using only female individuals).

For XPAR variants, they were preserved, if:

* Variant filter was PASS; and
* QD for SNPs > 2 and for indels > 4; and
* AC > 0; and
* Variant-wise CR > 90%; and
* pHWE > 1e-9.

## 4. Imputation reference panel generation

To generate a high-quality hcWGS reference panel, the QC'ed data was further filtered and variants with AC < 3 (*symmetrically\**) were excluded. Haplotype phasing was carried out with [Eagle 2.4.1](https://alkesgroup.broadinstitute.org/Eagle/) software ([Source](https://alkesgroup.broadinstitute.org/Eagle/downloads/), [Manual](https://alkesgroup.broadinstitute.org/Eagle/)) with the default parameters, except that the number of conditioning haplotypes was set to 20,000. Beagle-specific reference panel files (`.bref`) were created as instructed by the [Beagle](https://faculty.washington.edu/browning/beagle/b4_1.html) authors.

## 5. Additional information

Sample sex inference

Bi-allelic variants on chromosome X, excluding the ones on low-complexity or pseudo-autosomal regions, were utilised to identify samples with ambiguous sex for exclusion.

**Genotypes were set as missing, if:**

* Sequencing read depth (DP) > 200; or
* PHRED-scaled genotype quality (GQ) < 20; or
* For homozygous reference calls (0/0): the proportion of informative reads (reference AD / DP) < 0.9:
* For heterozygous variant calls (0/1): the proportion of informative reads (total allele depth \[AD] / depth \[DP]) < 0.9 or the proportion of informative reads (alternative AD / DP) < 0.25 or the normalized PHRED-scaled probability of the reference genotype (pl\[0]) < 20 or p-value for pulling the given allelic depth from a binomial distribution with mean 0.5 (pAB) < 1e-9;
* For homozygous variant calls (1/1): the proportion of informative reads (alternative AD / DP) < 0.9 or pl\[0] < 20;

**Variants were preserved, if:**

* variant filter was PASS; and
* QD for SNPs > 2 and for indels > 3; and
* AC >= 1; and
* Variant-wise CR > 80%

Genetic sex was imputed with Plink v1.90b6.18 using threshold 0.2 and 0.8 for females and males, respectively.

Samples with ambiguous sex information (opposite imputed-sex compared with biobank sex report or imputed as '*ambiguous*') were identified and excluded.

See also [Genotype Imputation](/background-reading/imputation) section for general information about imputation.

***Footer***:

*`^Iterative manner`:* For a certain step, for example, sample-wise QC step: we started with removing outliers deviating more than ±4SD from sample-wise QC metrics (nSNP, rHetHomVar, rTiTv, rInsertionDeletion, dpStDev). After removing, we recalculated and replotted these metrics. We were not satisfied with the result, so we adjusted our threshold to ±3SD. ‘applied in an iterative manner’ means: repeating the same process (apply filter, calculate/plot metrics, check result), until we get satisfied results. Then, we move on to the next step.

`*`*`Symmertrically`*: means removing MAC<3 variants for both (lower and upper) ends of the frequency spectrum. In practise, with bcftools, it is applied as: bcftools view -e 'INFO/AC<3| INFO/AN-INFO/AC<3'. By doing this we can remove ‘singleton’ and ‘doubleton’ variants (from both ends of the allele frequency spectrum) that can’t be phased accurately.


# Variant-wise QC metrics file

Variant-wise QC metrics file is available to Sandbox users.

**Sandbox directory**

Variant-wise metrics file (and index file) are available in the following sandbox directory:

```
gs://finngen-production-library-green/imputation_panel/v4.2/variant_qc/sisu4.2_panel_var_wise_QC_metrics/
```

To generate SISu v4.2 reference panel, sample-, genotype- and variant-wise quality control (QC) filtering procedures were applied by an iterative manner on the high-coverage WGS (hcWGS) data. Then, a allele count (AC) > 2 cutting off was applied, symmetrically. Variant-wise metrics were exported for monitoring data quality after major QC steps.

We offer variant-wise QC metrics tsv files of Sisu v4.2 reference panel after major QC steps: raw data, after sample-wise QC data and after sample-, genotype- and variant-wise QC data, for autosomal chromosomes and chromosome X separately.

**Variant-wise QC metrics file**

| QC Steps                                   | Autosomal chromosome                                                                                      | Chromosome X                                                                                                                                                                                                |
| ------------------------------------------ | --------------------------------------------------------------------------------------------------------- | ----------------------------------------------------------------------------------------------------------------------------------------------------------------------------------------------------------- |
| Raw VCF data from WashU (w/ 10500 samples) | sisu4.2\_panel\_autosomal\_raw\_variant\_wise\_qc\_metrics.tsv.gz / .tbi                                  | sisu4.2\_panel\_chrX\_raw\_variant\_wise\_qc\_metrics.tsv.gz                                                                                                                                                |
| After sample-wise QC (w/ 8554 samples)     | sisu4.2\_panel\_autosomal\_after\_sample\_qc\_variant\_wise\_qc\_metrics.tsv.gz / .tbi                    | sisu4.2\_panel\_chrX\_after\_sample\_qc\_variant\_wise\_qc\_metrics.tsv.gz                                                                                                                                  |
| After genotype- and variant-wise QC        | sisu4.2\_panel\_autosomal\_after\_sample\_genotype\_variant\_qc\_variant\_wise\_qc\_metrics.tsv.gz / .tbi | sisu4.2\_panel\_chrX\_XPAR\_after\_sample\_genotype\_variant\_qc\_variant\_wise\_qc\_metrics.tsv.gz; sisu4.2\_panel\_chrX\_nonXPAR\_after\_sample\_genotype\_variant\_qc\_variant\_wise\_qc\_metrics.tsv.gz |
| After AC>2 filtering, symmetrically        |                                                                                                           |                                                                                                                                                                                                             |

**General description**

Autosomal chromosomes variant-wise metrics file contains 24 columns:

| Column Number | Name                  | Type            | Description                                                                                |
| ------------- | --------------------- | --------------- | ------------------------------------------------------------------------------------------ |
| 1             | #chr                  | int             | Chromosome number (1-22) where the variant is located                                      |
| 2             | pos                   | int             | Genomic position of the variant on the specified chromosome                                |
| 3             | Variant               | string          | Variant identifier in the format "chromosome:position:reference\_allele:alternate\_allele" |
| 4             | callRate              | double          | Fraction of samples with called genotypes                                                  |
| 5             | AC                    | int             | Count of alternate alleles                                                                 |
| 6             | AF                    | double          | Calculated alternate allele frequency (q)                                                  |
| 7             | nCalled               | int             | Sum of nHomRef, nHet, and nHomVar                                                          |
| 8             | nNotCalled            | int             | Number of uncalled samples                                                                 |
| 9             | nHomRef               | int             | Number of homozygous reference samples                                                     |
| 10            | nHet                  | int             | Number of heterozygous samples                                                             |
| 11            | nHomVar               | int             | Number of homozygous alternate samples                                                     |
| 12            | dpMean                | double          | Depth mean across all samples                                                              |
| 13            | dpStDev               | double          | Depth standard deviation across all samples                                                |
| 14            | gqMean                | double          | The average genotype quality across all samples                                            |
| 15            | dpStDev               | double          | Depth standard deviation across all samples                                                |
| 16            | nNonRef               | int             | Sum of nHet and nHomVar                                                                    |
| 17            | rHeterozygosity       | double          | Proportion of heterozygotes                                                                |
| 18            | rHetHomVar            | double          | Ratio of heterozygotes to homozygous alternates                                            |
| 19            | rExpectedHetFrequency | double          | Expected rHeterozygosity based on HWE                                                      |
| 20            | pHWE                  | double          | p-value from Hardy Weinberg Equilibrium null model                                         |
| 21            | FILTERS               | list of strings | FILTER entry in the VCF, \[] means PASS                                                    |
| 22            | QD                    | double          | Quality by Depth (QD) of INFO field in the VCF                                             |
| 23            | IS\_INDEL             | boolean         | Insertion-deletion variant                                                                 |
| 24            | IS\_SNP               | boolean         | Single nucleotide variant                                                                  |

Chromosome X variant-wise metrics file contains 25 columns:

| Column Number | Name                              | Type            | Description                                                                                                                             |
| ------------- | --------------------------------- | --------------- | --------------------------------------------------------------------------------------------------------------------------------------- |
| 1             | locus                             | tlocus          | Hail type for a genomic coordinate with a contig and a position, e.g., chrX:10009                                                       |
| 2             | alleles                           | tarray of tstr  | Hail type for variable-length arrays of text strings, e.g., \["A","G"]                                                                  |
| 3             | filters                           | list of strings | FILTER entry in the VCF, \[] means PASS                                                                                                 |
| 4             | variant\_qc.dp\_stats.mean        | float64         | Mean depth of coverage (DP) across samples.                                                                                             |
| 5             | variant\_qc.dp\_stats.stdev       | float64         | Standard deviation of depth of coverage (DP) across samples.                                                                            |
| 6             | variant\_qc.dp\_stats.min         | int32           | Minimum depth of coverage (DP) across samples.                                                                                          |
| 7             | variant\_qc.dp\_stats.max         | int32           | Maximum depth of coverage (DP) across samples.                                                                                          |
| 8             | variant\_qc.gq\_stats.mean        | float64         | Mean genotype quality (GQ) across samples.                                                                                              |
| 9             | variant\_qc.gq\_stats.stdev       | float64         | Standard deviation of genotype quality (GQ) across samples.                                                                             |
| 10            | variant\_qc.gq\_stats.min         | int32           | Minimum genotype quality (GQ) across samples.                                                                                           |
| 11            | variant\_qc.gq\_stats.max         | int32           | Maximum genotype quality (GQ) across samples.                                                                                           |
| 12            | variant\_qc.AC                    | array\<int32>   | Calculated allele count, one element per allele, including the reference. Sums to AN.                                                   |
| 13            | variant\_qc.AF                    | array\<float64> | Calculated allele frequency, one element per allele, including the reference. Sums to one. Equivalent to AC / AN.                       |
| 14            | variant\_qc.AN                    | int32           | Total number of called alleles.                                                                                                         |
| 15            | variant\_qc.homozygote\_count     | array\<int32>   | Number of homozygotes per allele. One element per allele, including the reference.                                                      |
| 16            | variant\_qc.call\_rate            | float64         | Fraction of calls neither missing nor filtered. Equivalent to n\_called / count\_cols().                                                |
| 17            | variant\_qc.n\_called             | int64           | Number of samples with a defined GT.                                                                                                    |
| 18            | variant\_qc.n\_not\_called        | int64           | Number of samples with a missing GT.                                                                                                    |
| 19            | variant\_qc.n\_filtered           | int64           | Number of filtered entries.                                                                                                             |
| 20            | variant\_qc.n\_het                | int64           | Number of heterozygous samples.                                                                                                         |
| 21            | variant\_qc.n\_non\_ref           | int64           | Number of samples with at least one called non-reference allele.                                                                        |
| 22            | variant\_qc.het\_freq\_hwe        | float64         | Expected frequency of heterozygous samples under Hardy-Weinberg equilibrium. See functions.hardy\_weinberg\_test() for details.         |
| 23            | variant\_qc.p\_value\_hwe         | float64         | p-value from two-sided test of Hardy-Weinberg equilibrium. See functions.hardy\_weinberg\_test() for details.                           |
| 24            | variant\_qc.p\_value\_excess\_het | float64         | p-value from one-sided test of Hardy-Weinberg equilibrium for excess heterozygosity. See functions.hardy\_weinberg\_test() for details. |
| 25            | info.QD                           | double          | Quality by Depth (QD) of INFO field in the VCF.                                                                                         |


# Sisu v4 reference panel

As of August 2021, the [Sisu v4 reference panel](https://www.finngen.fi/en/members/document/222) is used as the imputation panel in FinnGen.

| **Summary:**                     | Descriptors            |
| -------------------------------- | ---------------------- |
| Total number of samples:         | 8,554                  |
| Total number of variant alleles: | 20,175,454             |
| Chromosomes:                     | chrs 1-22, chrX        |
| Variants included:               | SNV and InDel variants |
| Panel file format:               | BREF, phased VCF       |
| Reference genome build:          | GRCh38                 |
| Docs last updated:               | 17.08.2021             |

[SISu v4](https://finngen.gitbook.io/documentation/methods/genotype-imputation/sisu-reference-panel) reference panel contains samples from the following cohorts and sample collections: FINRISK, METSIM, Corogene, Finnish Dyslipidemia Study and Eastern Finland biobank samples. Genotype, sample and variant-wise quality control (QC) filtering procedures were applied in an *iterative manner^* on the high-coverage WGS (hcWGS) data using the Hail framework v0.1 (unless mentioned otherwise).

## 1. Genotype-wise QC

genotypes were marked as *‘missing’* (./.) if:

**All autosomal chromosomes:**

* Sequencing read depth (DP) > 200; or
* PHRED-scaled genotype quality (GQ) < 20; or
* the proportion of informative reads (total allele depth \[AD] / depth \[DP]) < 0.9; or
* For homozygous reference calls (0/0): the proportion of informative reference reads (reference AD / DP) < 0.9;
* For heterozygous variant calls (0/1): the proportion of informative alternate reads (alternative AD / DP) was not within the interval 0.2-0.8 or the normalized PHRED-scaled probability of the reference genotype (pl\[0]) < 20;
* For homozygous variant calls (1/1): the proportion of informative alternate reads (alternative AD / DP) < 0.9 or pl\[0] < 20;\\

**Chromosome X:**

genotypes were marked as ‘*missing*’ (`./.`) if:

* DP > 200; or
* GQ < 10 for male individuals; or
* GQ < 20 for female individuals; or
* the proportion of informative reads (total allele depth \[AD] / depth \[DP]) < 0.9; or
* For homozygous reference calls (0/0): the proportion of informative reads (reference AD / DP) < 0.9;
* For heterozygous variant calls (0/1): the proportion of informative reads (alternative AD / DP) was not within the interval 0.2-0.8 or the normalized PHRED-scaled probability of the reference genotype (pl\[0]) < 20 or was male;
* For homozygous variant calls (1/1): the proportion of informative reads (alternative AD / DP) < 0.9 or pl\[0] < 20

## 2. Sample-wise QC/filtering

To include only high-quality samples, the following sample-wise QC criteria were first applied to bi-allelic variants on autosomes (excluding variants in low-complexity regions).

**Variants were preserved (for calculating sample-wise metrics) if:**

* variant filter was PASS; and
* quality by depth (QD) for SNPs was > 2 and for indels > 3; and
* allele count (AC) was ≥ 3; and
* Variant-wise call-rate (CR) > 90%; and
* Hardy-Weinberg Equilibrium p-value (pHWE) > 1e-9.

Outlier samples with CR <= 95% or deviating more than ±3SD were identified from sample-wise QC metrics (nSNP, rHetHomVar, rTiTv, rInsertionDeletion, dpStDev) and excluded (Table 1). In addition, a number of low Indel quality individuals were removed from the data to fix observed batch-effects (Outliers with Indels showing obviously lower value of rInsertionDeletion).

In order to identify closely-related samples, the data was further LD-pruned with window size 1M and r2 = 0.2 by first keeping only bi-allelic variants and excluding variants on high-LD regions, pHWE <= 1e-9, minor allele frequency (MAF) < 0.05 and variant-wise CR <= 90%. With Plink v2.0 [KING](https://www.cog-genomics.org/plink/2.0/distance#make_king) method, closely-related individuals (kinship coefficient < 0.177) were identified from the LD-pruned data and excluded.

Then, the top 20 principal components (PCs) were computed and outlier samples to be excluded were identified based on these 20 PCs. Next, individuals with **ambiguous sex1** (samples with imputed sex conflicting with biobank reported sex or for which imputed sex is 'ambiguous') were identified and excluded. Furthermore, we additionally removed 53 samples as they were obvious QC outliers considering the following sample-wise metrics (rInsertionDeletion < 0.985, nSingleton>50000).

Outlier samples listed in the above steps were excluded from the data before applying variant-wise QC/filtering)

**Table 1.** Definition of terms

| **Name**           | **Type** | **Description**                                          |
| ------------------ | -------- | -------------------------------------------------------- |
| callRate           | Double   | Fraction of genotypes called                             |
| nHomRef            | Int      | Number of homozygous reference genotypes                 |
| nHet               | Int      | Number of heterozygous genotypes                         |
| nHomVar            | Int      | Number of homozygous alternate genotypes                 |
| nCalled            | Int      | Sum of nHomRef + nHet + nHomVar                          |
| nNotCalled         | Int      | Number of uncalled genotypes                             |
| nSNP               | Int      | Number of SNP alternate alleles                          |
| nInsertion         | Int      | Number of insertion alternate alleles                    |
| nDeletion          | Int      | Number of deletion alternate alleles                     |
| nSingleton         | Int      | Number of private alleles                                |
| nTransition        | Int      | Number of transition (A-G, C-T) alternate alleles        |
| nTransversion      | Int      | Number of transversion alternate alleles                 |
| nNonRef            | Int      | Sum of nHet and nHomVar                                  |
| rTiTv              | Double   | Transition/Transversion ratio                            |
| rHetHomVar         | Double   | Het/HomVar genotype ratio                                |
| rInsertionDeletion | Double   | Insertion/Deletion ratio                                 |
| dpMean             | Double   | Depth mean across all genotypes                          |
| dpStDev            | Double   | Depth standard deviation across all genotypes            |
| gqMean             | Double   | The average genotype quality across all genotypes        |
| gqStDev            | Double   | Genotype quality standard deviation across all genotypes |

## 3. Variant-wise QC/filtering

Mitochondrial and chromosome Y variants, variants within pseudo-autosomal regions on chromosome X (X PAR region) or low-complexity regions (LCR) on any chromosomes were excluded. In order to preserve multiallelic sites, they were decomposed into bi-allelic format.

**Autosomal chromosomes:**

Genotypes were set as missing based on the above-mentioned (step 1 Genotype-wise QC/filtering) thresholds.

Next, variants were preserved, if:

* variant filter was PASS; and
* QD for SNPs > 2 and for indels > 4; and
* AC > 0; and
* Variant-wise CR > 95%; and
* pHWE > 1e-9.

**Chromosome X:**

genotypes were marked as ‘*missing*’ (`./.`) if:

* DP > 200; or
* GQ < 10 for male individuals; or
* GQ < 20 for female individuals; or
* the proportion of informative reads (total allele depth \[AD] / depth \[DP]) < 0.9; or
* For homozygous reference calls (0/0): the proportion of informative reads (reference AD / DP) < 0.9;
* For heterozygous variant calls (0/1): the proportion of informative reads (alternative AD / DP) was not within the interval 0.2-0.8 or the normalized PHRED-scaled probability of the reference genotype (pl\[0]) < 20 or the individual was male;
* For homozygous variant calls (1/1): the proportion of informative reads (alternative AD / DP) < 0.9 or pl\[0] < 20;

Next, variants were preserved, if:

* variant filter was PASS; and
* QD for SNPs > 2 and for indels > 4; and
* AC > 0; and
* Variant-wise CR > 95%; and
* pHWE > 1e-9 (pHWE was calculated by using only female individuals).

## 4. Imputation reference panel generation

To generate a high-quality hcWGS reference panel, the QC'ed data was further filtered and variants with AC < 3 (*symmetrically\**) were excluded. Haplotype phasing was carried out with [Eagle 2.4.1](https://alkesgroup.broadinstitute.org/Eagle/) software ([Source](https://alkesgroup.broadinstitute.org/Eagle/downloads/), [Manual](https://alkesgroup.broadinstitute.org/Eagle/)) with the default parameters, except that the number of conditioning haplotypes was set to 20,000. Beagle-specific reference panel files (`.bref`) were created as instructed by the [Beagle](https://faculty.washington.edu/browning/beagle/b4_1.html) authors.

## 5. Additional information

Sample sex inference

Bi-allelic variants on chromosome X, excluding the ones on low-complexity or pseudo-autosomal regions, were utilised to identify samples with ambiguous sex for exclusion.

**Genotypes were set as missing, if:**

* Sequencing read depth (DP) > 200; or
* PHRED-scaled genotype quality (GQ) < 20; or
* For homozygous reference calls (0/0): the proportion of informative reads (reference AD / DP) < 0.9:
* For heterozygous variant calls (0/1): the proportion of informative reads (total allele depth \[AD] / depth \[DP]) < 0.9 or the proportion of informative reads (alternative AD / DP) < 0.25 or the normalized PHRED-scaled probability of the reference genotype (pl\[0]) < 20 or p-value for pulling the given allelic depth from a binomial distribution with mean 0.5 (pAB) < 1e-9;
* For homozygous variant calls (1/1): the proportion of informative reads (alternative AD / DP) < 0.9 or pl\[0] < 20;

**Variants were preserved, if:**

* variant filter was PASS; and
* QD for SNPs > 2 and for indels > 3; and
* AC >= 1; and
* Variant-wise CR > 80%

Genetic sex was imputed with Plink v1.90b6.18 using threshold 0.2 and 0.8 for females and males, respectively.

Samples with ambiguous sex information (opposite imputed-sex compared with biobank sex report or imputed as '*ambiguous*') were identified and excluded.

Summary of SISu v4.0 reference panel as [pdf](https://www.finngen.fi/en/members/document/222).

See also [Genotype Imputation](/background-reading/imputation) section for general information about imputation.

***Footer***:

*`^Iterative manner`:* For a certain step, for example, sample-wise QC step: we started with removing outliers deviating more than ±4SD from sample-wise QC metrics (nSNP, rHetHomVar, rTiTv, rInsertionDeletion, dpStDev). After removing, we recalculated and replotted these metrics. We were not satisfied with the result, so we adjusted our threshold to ±3SD. ‘applied in an iterative manner’ means: repeating the same process (apply filter, calculate/plot metrics, check result), until we get satisfied results. Then, we move on to the next step.

`*`*`Symmertrically`*: means removing MAC<3 variants for both (lower and upper) ends of the frequency spectrum. In practise, with bcftools, it is applied as: bcftools view -e 'INFO/AC<3| INFO/AN-INFO/AC<3'. By doing this we can remove ‘singleton’ and ‘doubleton’ variants (from both ends of the allele frequency spectrum) that can’t be phased accurately.


# Sisu v3 reference panel

As of FinnGen R2, the SISu v3 reference panel is used as the imputation panel in FinnGen.

High-coverage (25-30x) WGS data for 4,083 Finn were generated at the Broad Institute of MIT and Harvard, and at the McDonnell Genome Institute at Washington University; and jointly processed at the Broad Institute. Variant call set was produced with GATK HaplotypeCaller algorithm by following GATK best-practices for variant calling. Genotype-, variant- and sample-wise QC was applied in an iterative manner by using the [Hail v0.1](https://hail.is). To generate the imputation reference panel, the quality controlled data for 3,775 high-quality samples were further filtered for allele count (AC) < 3. Haplotype phasing was carried out with [Eagle 2.3.5 software](https://data.broadinstitute.org/alkesgroup/Eagle) with the default parameters, except that the number of conditioning haplotypes was set to 20,000.

As of July 2021, FinnGen genotype imputation is carried out according to [Genotype imputation workflow v3.0 V.2](https://www.protocols.io/view/genotype-imputation-workflow-v3-0-xbgfijw) protocol. See also [Genotype imputation](https://finngen.gitbook.io/documentation/methods/genotype-imputation/genotype-imputation) for details on the imputation process.

### Detailed description:

The SISu v3 reference panel contains samples from the following cohorts/studies:

* **METSIM\*** (PIs: Markku Laakso and Mike Boehnke)
* **FINRISK**\*\*,#¤ (PI: Pekka Jousilahti)
* **Health2000** \*\*,#%(PI: Seppo Koskinen)
* **Finnish Migraine Family Study**\*\*,#& (PI: Aarno Palotie)
* **Merck/Tienari samples\*\*** (PI: Pentti Tienari)
* **MESTA samples\*\*** (PI: Jaana Suvisaari)

\*sequenced at the McDonnell Genome Institute at Washington University

\*\* sequenced at the Broad Institute of MIT and Harvard

\#part of the SISu v3-THL reference panel available through National Institute for Health and Welfare (THL)

¤ **FINRISK**, N=1160, (National Institute for Health and Welfare/THL Biobank). A representative, cross-sectional population surveys from six areas of Finland. Baseline years 1992, 1997, 2002 and 2007.

% **Health 2000 and 2011** Surveys, N=205, (National Institute for Health and Welfare/THL Biobank). A nationally representative sample of individuals living in Finland in 2000-2001.

& **The Finnish Migraine Family Study**, N=403, (University of Helsinki/THL Biobank). The sample collection includes persons who have been diagnosed with migraine and their family members. The samples have been collected since 1992. First-degree relatives in the Migraine Study have been removed from the reference panel data

### High-coverage WGS data processing

Genotype-, sample- and variant-wise quality control (QC) filtering procedures were applied by an iterative manner on the high-coverage WGS (hcWGS) data using the [Hail framework](https://hail.is) v0.1 (unless mentioned otherwise)

**1. Genotype-wise QC**

Genotypes were set as missing if:

* sequencing read depth (DP) was > 200; or
* PHRED-scaled genotype quality (GQ) value was < 20; or
* the proportion of informative reads (total allele depth \[AD] / depth \[DP]) was < 0.9; or

for homozygous reference calls:

* the proportion of informative reads (reference AD / DP) was < 0.9;

for heterozygous variant calls (autosomal chromosomes):

* the proportion of informative reads (alternative AD / DP) was not within the interval 0.2-0.8; or
* the normalized PHRED-scaled probability of the reference genotype (pl\[0]) was < 20;

for heterozygous variant calls (chromosome X):

* the proportion of informative reads (total AD / DP) was < 0.9; or
* the proportion of informative reads (alternative AD / DP) < 0.25; or
* pl\[0] was < 20; or
* p-value for pulling the given allelic depth from a binomial distribution with mean 0.5 (pAB) was < 1e-9; or
* the gender was male

for homozygous variant calls:

* the proportion of informative reads (alternative AD / DP) was < 0.9; or
* pl\[0] was < 20.

**2. Sample-wise QC/filtering**

To identify the first list of excludable samples, relatively stringent QC thresholds were first applied for autosomal chromosomes and bi-allelic variants excluding the ones on low-complexity regions.

Variants were preserved (for calculating sample-wise metrics) if:

* variant quality score recalibration (VQSR) filter was PASS; and
* quality by depth (QD) for SNPs was ≥ 2 and for indels ≥ 3; and
* allele count (AC) was ≥ 3; and
* call-rate (CR) ≥ 90%; and
* Hardy-Weinberg Equilibrium p-value (pHWE) ≥ 1e-9.

Outlier samples deviating more than ±3SD were identified from sample-wise QC metrics (nSNP, rHetHom, rInsertionDeletion, rTiTv). The data was further LD-pruned with window size 1M and r2 = 0.2 by first excluding variants on high-LD regions (lifted over from GRCh37 by [NCBI Remap](https://www.ncbi.nlm.nih.gov/genome/tools/remap), minor allele frequency (MAF) < 0.05 and CR < 90%. With [Plink v2.0](https://www.cog-genomics.org/plink2) KING method, related individuals (kinship coefficient < 0.177) were identified from the LD-pruned data and excluded. Then, the top 20 principal component (PC) scores were computed and outlier samples to be excluded were identified based on the first 10 PCs.

Outlier samples (sample-wise QC outliers, related individuals, PCA outliers, individuals with ambiguous gender) were excluded from the data before applying variant-wise QC/filtering.

**3. Variant-wise QC/filtering**

Mitochondrial and chromosome Y variants, variants on alternative haplotypes or within pseudo-autosomal regions on chromosome X or low-complexity regions on any chromosomes were excluded. In order to preserve multiallelic sites, they were decomposed into bi-allelic records.

Genotypes were set as missing based on the above-mentioned (step 1) thresholds.

Next, variants were preserved, if:

* variant quality score recalibration (VQSR) filter was PASS; and
* quality by depth (QD) for SNPs was ≥ 2 and for indels ≥ 6; and
* AC was > 0; and
* CR was ≥ 90%; and
* pHWE for autosomal chromosomes and for females on chromosome X was ≥ 1e-9.

Notable batch effects between samples sequenced at different sites (Washington University and Broad) and with PCR+ or PCR- protocols were observed in sample-wise QC metrics, mainly chrX coverage and for indels on autosomal chromosomes. Thus, for autosomal chromosomes, variant-wise CRs were calculated over samples grouped by the sequencing site. SNPs showing ≥ 5% and indels showing ≥ 3% difference in CRs between the sequencing sites were excluded. Remaining variants that still demonstrated some differences in relevant QC metrics were further enlisted in variant blacklists.

**4. Imputation reference panel generation**

To generate a high-quality hcWGS reference panel, the QC'ed data was further filtered and variants with AC < 3 were excluded. Haplotype phasing was carried out with [Eagle 2.3.5 software ](https://data.broadinstitute.org/alkesgroup/Eagle)with the default parameters, except that the number of conditioning haplotypes was set to 20,000. Beagle-specific reference panel files (.bref) were created as instructed by the [Beagle](https://faculty.washington.edu/browning/beagle/b4_1.html).

Summary of SISu v3.0 reference panel as [pdf.](https://finngen.gitbook.io/documentation/methods/genotype-imputation/sisu-reference-panel)

See also [Genotype Imputation](/background-reading/imputation) section for general information about imputation.


# Genome build used in FinnGen

Human reference genome build [GRCh38/hg38](https://www.ncbi.nlm.nih.gov/assembly/GCF_000001405.26/) is used for FinnGen genotype data. All alleles are coded according to the [GRCh38/hg38](https://www.ncbi.nlm.nih.gov/assembly/GCF_000001405.26/) build reference alleles, and all alternative alleles are left-aligned in respect to the original variant position.

Chip array datasets generated based on previous reference genome builds are lifted-over to the [GRCh38/hg38](https://www.ncbi.nlm.nih.gov/assembly/GCF_000001405.26/) build according to [this protocol](https://www.protocols.io/view/genotyping-chip-data-lift-over-to-reference-genome-xbhfij6)

## Genotype reporting

* Imputed alleles are coded `0` or `1`, separated with ‘`|`’ (*phased*): `0` is for reference/wild type (WT) allele and `1` is for alternative allele.
* In raw chip data alleles are coded `0` or `1`, separated with ‘`/`’ (*unphased*): `0` is for reference/wild type (WT) allele and `1` is for alternative allele.

*Therefore,* genotypes can be of the form:

**Post-Imputation Genotype Files (phased):**

* `0|1` or `1|0` heterozygotes
* `1|1` homozygotes
* `0|0` WT homozygotes
* `.|.` missing data

**Raw Chip data (unphased)**

* `0/1` heterozygotes
* `1/1` homozygotes
* `0/0` WT homozygotes
* `./.` missing data

[Click here to read how to work with variant level data in the Sandbox](/working-in-the-sandbox/working-with-genotype-data)


# Genotype Data Processing Flow

Genotypes come into the FinnGen project from two sources, where we go into detail in the [Genotype Arrays Used](/finngen-data-specifics/red-library-data-individual-level-data/genotype-data/affymetrix-chip-and-its-design) section

1\) **FinnGen specific Affymetrix arrays.** Containing many rare variants specific to Finland

2\) **Legacy cohorts / batches.** Obtained from other Finnish studies.

In the documentation section on [genotype browser how to](/working-in-the-sandbox/working-with-genotype-data/genotype-browser) we give a rough estimate of how the legacy cohorts contribute to each data freeze and some of the chips that were used for those. Samples are then grouped into batches of 5000 samples.

## Chip Genotype Data Processing and QC

Samples were genotyped with Illumina (Illumina Inc., San Diego, CA, USA) and Affymetrix arrays (Thermo Fisher Scientific, Santa Clara, CA, USA).

Genotype calls were made with GenCall and zCall algorithms for Illumina and AxiomGT1 algorithm for Affymetrix data. Chip genotyping data produced with previous chip platforms and reference genome builds were lifted over to build version 38 (GRCh38/hg38) following the protocol described [here](https://www.protocols.io/view/genotyping-chip-data-lift-over-to-reference-genome-nqtddwn?version_warning=no).

### Basic QC immediately after receiving new dataset from FinnGen-specific Affymetrix arrays

* Data set integrity comparison of received MD5sums to calculated ones
* Sample missingness >95%
* Exclude samples without sex information or incorrect sex
* List samples with different subject ID but same genome (within dataset) -> Genotyping team verifies if the subjects are identical twins or sample mixups. Sample mix ups are added to the exclusion list.
* Select best duplicate on the basis of call rate (within a dataset, among known control duplicates.
* Variant wise QC metrics are reported.

Sample mixup reports are received from Biobanks and FinnGen DNA team and removed from further processing.

### Genotype QC for imputation and chip data releases

#### Sample QC:

* Remove samples where genetic sex does not match provided sex from registries (female: *f* < 0.4, male: *f* >0.7)
* Remove samples with variant missingness >0.02
* Remove samples with high heterozygosity in common variants (allele frequency > 0.05) ( > 3 standard deviations from the mean) per batch
* Remove samples with excess relatedness to other samples ( $$\hat\pi$$ > 0.1) in 2 rounds:
  * First, remove those with a lot of relatedness ( *n* > 500) and
  * Second, rerun *n* >50. The heterozygosity step handles FinnGen chip excess relatedness but legacy chips have a few outliers remaining where this step removes the problematic samples.

#### Variant QC:

* Map variants to reference genome, left align and minimize allele representation. Annotate variant id as `chr:pos:ref:alt`
  * Remove variants with alleles other than represented with \[ATCG]
* Compare variants against imputation panel:
  * Remove if not in panel (for imputation only, these remain in the chip dataset)
  * Remove if allele frequency in panel < 0.001 (for imputation only, these remain in the chip dataset)
  * Remove variants where allele frequency differs significantly from panel ( $$p < 5 \times10^{-8}$$) adjusted for the first 10 principal components
* Remove variant from all batches (FinnGen chip data and legacy data processed separately) if:
  * HWE p-value < 10-10 across all batches (exception: variants below a given frequency that have a deficiency in homozygotes escape this exclusion)
  * more than 15% of the batches have missingness > 0.04
  * is non-PASS in more than 30% if the batches
* Remove variants within a batch if:
  * $$P\_{HWE} < 10^{-6}$$
  * missingess > 0.02 (0.05 for Y chromosome)
  * variant is non-PASS

A single variant (chr12\_71584145\_G\_T) was force imputed (removed from all batches in imputation qc)

Chip genotyped samples were then pre-phased with [Eagle 2.3.5](https://data.broadinstitute.org/alkesgroup/Eagle/) with the default parameters, except the number of conditioning haplotypes was set to 20,000.

The location of Markdown of all DF10 genotype QC for both chip and imputation data in Sandbox: `/finngen/library-red/finngen_R10/R10_genotype_qc.md`

## Genotype imputation with the population-specific reference panel

High-coverage (25x) WGS data used to develop the [SISu v4.2 reference panel ](/finngen-data-specifics/red-library-data-individual-level-data/genotype-data/imputation-panel/sisu-v4-reference-panel)(Palta et al., manuscript in preparation) were generated at the McDonnell Genome Institute at Washington University for imputation. Details can be found in the [Imputation Panel](/finngen-data-specifics/red-library-data-individual-level-data/genotype-data/imputation-panel) section.

[Click here to read more about Sisu reference panel](/finngen-data-specifics/red-library-data-individual-level-data/genotype-data/imputation-panel).


# Genotype Files in Sandbox

FinnGen updates genotype data in each [Data Release](/finngen-data-specifics/finngen-data-freezes-and-releases) and makes these files available to Sandbox users.

### Sandbox directory

Since Data Release 4 genotype data is available in the following sandbox directory:

`/finngen/library-red/finngen_R[RELEASE]`

The genotype data of releases 1-3 can be found from:

`/finngen/library-red/finngen_R[RELEASE]_core_analysis_results`

### Data files

The data files are described in the following sections:

[Imputed genotypes in VCF format](/finngen-data-specifics/red-library-data-individual-level-data/genotype-data/types-of-genotype-files-available/imputation-data-file)

[Imputed genotypes in BGEN format](/finngen-data-specifics/red-library-data-individual-level-data/genotype-data/types-of-genotype-files-available/bgen-file)

[Imputed genotypes in PLINK format](/finngen-data-specifics/red-library-data-individual-level-data/genotype-data/types-of-genotype-files-available/genotype-plink-data)

[Chip data](/finngen-data-specifics/red-library-data-individual-level-data/genotype-data/types-of-genotype-files-available/chip-data-file)

[Imputed HLA alleles](/finngen-data-specifics/red-library-data-individual-level-data/genotype-data/types-of-genotype-files-available/imputed-hla-alleles)

[Principal components analysis (PCA) data](/finngen-data-specifics/red-library-data-individual-level-data/genotype-data/types-of-genotype-files-available/pca-data)

[Kinship data](/finngen-data-specifics/red-library-data-individual-level-data/genotype-data/types-of-genotype-files-available/kinship-data)

[Analysis covariates](/finngen-data-specifics/red-library-data-individual-level-data/genotype-data/types-of-genotype-files-available/covariate-file)

[Polygenic risk scores (PRS)](/finngen-data-specifics/red-library-data-individual-level-data/genotype-data/types-of-genotype-files-available/prs-data)

[Genetic relationships (GRM)](/finngen-data-specifics/red-library-data-individual-level-data/genotype-data/types-of-genotype-files-available/grm-data)

[Mosaic chromosomal alternations (mCA)](/finngen-data-specifics/red-library-data-individual-level-data/genotype-data/types-of-genotype-files-available/mca-data)

[Prune data (R9)](/finngen-data-specifics/red-library-data-individual-level-data/genotype-data/types-of-genotype-files-available/prune-data)

[Imputed STR genotypes (R8)](/finngen-data-specifics/red-library-data-individual-level-data/genotype-data/types-of-genotype-files-available/imputed-str-genotypes)

See [Release Notes](/release-notes) to view all data releases to the Sandbox.

**Note.** If multiple versions of the same files exist, use the newest. Readmes should describe the version differences.

###


# Imputed genotypes in VCF format

This page has been last updated for R11.

### Sandbox directory

Imputed genotypes in the [VCF](https://en.wikipedia.org/wiki/Variant_Call_Format) format are available in the following Sandbox directory:

`/finngen/library-red/finngen_R[RELEASE]/genotype_1.0`

### Data files

One VCF file is available for each chromosome:

`data/finngen_R[RELEASE]_chr[CHROM].vcf.gz`

The VCF files come with their `.tbi` files.

Please refer to the readme file in sandbox directory for full details of the available data.

### Further information

The imputed genotype data is comprised of multiple data sets that include samples from various cohorts. The exact batches and cohorts as well as VCF INFO field tags are explained in release supplementary files. [IMPUTE2](http://mathgen.stats.ox.ac.uk/impute/impute_v2.html) INFO metrics and allele frequencies (AF) are calculated per dataset, as well as for the entire dataset.

The data contains only variants present in the [imputation panel](/finngen-data-specifics/red-library-data-individual-level-data/genotype-data/imputation-panel). [Chip genotype data](/finngen-data-specifics/red-library-data-individual-level-data/genotype-data/types-of-genotype-files-available/chip-data-file) is released separately. Duplicate individuals (excluding identical twins) and biobank denials have been removed from the data.

All variants are on the forward strand.


# Imputed genotypes in BGEN format

This page has been last updated for R11.

### Sandbox directory

Imputed genotypes in the [BGEN](https://www.well.ox.ac.uk/~gav/bgen_format/) format (8-bit precision) are available in the following Sandbox directory:

`/finngen/library-red/finngen_R[RELEASE]/bgen`

### Data files

Two sets of BGEN files are available:

* variants per chromosome
* variants per chromosome chunked into smaller sets for parallel analysis (e.g. GWAS)

Both sets come with their `.bgi` and `.sample` files.

Please refer to the readme file in sandbox directory for full details of the available data.

#### **Variants per chromosome**

One BGEN file is available for each chromosome:

`data/chrom/finngen_R[RELEASE]_[CHROM].bgen`

#### **Variants per chromosome** chunked into smaller sets

We usually want to have smaller files to speed up parallel analysis (e.g. GWAS). For this reason, we have chunked the data so that each file contains a fixed smaller number of variants. The number can very between releases and is available in the readme file.

Chunked BGEN files are available for each chromosome:

`data/chunks/finngen_R[RELEASE]_[CHROM].[CHUNK].bgen`

The \[CHUNK] is an integer value that identifies each chunk for the chromosome.


# Imputed genotypes in PLINK format

This page has been last updated for R11.

### Sandbox directory

Imputed genotypes in the [PLINK](https://www.cog-genomics.org/plink2/input#bed) format are available in the following Sandbox directory:

`/finngen/library-red/finngen_R[RELEASE]/genotype_plink_1.0`

### Data files

Two sets of PLINK files are available:

* all variants
* HapMap3 filtered variants

Both sets come with their `.bed,` `.bim` `.fam, .afreq` files.

Please refer to the readme file in sandbox directory for full details of the available data.

#### All variants

All variants are available in the following files:

`data/finngen_R[RELEASE].bed`

`data/finngen_R[RELEASE].bim`

`data/finngen_R[RELEASE].fam`

`data/finngen_R[RELEASE].afreq`

#### HapMap3 filtered variants

HapMap3 filtered variants are available in the following files:

`data/finngen_R[RELEASE]_hm3.bed`

`data/finngen_R[RELEASE]_hm3.bim`

`data/finngen_R[RELEASE]_hm3.fam`

`data/finngen_R[RELEASE]_hm3.afreq`

### Further information

Read more about the [Plink 2.0 data format](https://www.cog-genomics.org/plink/2.0/formats).


# Chip data

This page has been last updated for R11.

### Sandbox directory

Chip data is available in the following Sandbox directory:

`/finngen/library-red/finngen_R[RELEASE]/chipd_1.0`

### Data files

The following files are available:

* all variants
* variants per chromosome

Please refer to the readme file in sandbox directory for full details of the available data.

#### All variants

All variants are available in the following PLINK files:

`data/plink/r[RELEASE]_axiom_chip_allchr.bed`

`data/plink/r[RELEASE]_axiom_chip_allchr.bim`

`data/plink/r[RELEASE]_axiom_chip_allchr.fam`

`data/plink/r[RELEASE]_axiom_chip_allchr.afreq`

#### Variants per chromosome

One [VCF](https://samtools.github.io/hts-specs/VCFv4.2.pdf) file is available for each chromosome:

`data/vcf/r[RELEASE]_axiom_chr[CHROM].vcf.gz`

The VCF files come with their `.tbi` files.

#### Futher information

The chip data is comprised of multiple Affymetrix batches including samples from multiple cohorts and hospital biobanks.

Variant-wise statistics for the whole dataset are listed in the [VFC](https://samtools.github.io/hts-specs/VCFv4.2.pdf) INFO field.

Only the samples genotyped by the FinnGen project are included. Duplicate individuals (excluding identical twins) and biobank denials have been removed from the data. Exact details about quality control filters can be found in the readme file.

The strand (reverse/forward) varies across the variants. The strand for each variant can be found in the marker content file that can be downloaded [here](https://www.finngen.fi/en/researchers/genotyping).

Refer to the [Genotype data processing flow ](/finngen-data-specifics/red-library-data-individual-level-data/genotype-data/description-of-how-the-data-is-processed-in-refinery)section for more information about chip data processing and QC.


# Imputed HLA alleles

This page has been last updated for R11.

### Sandbox directory

HLA alleles (short tandem repeat) genotypes are available in the following sandbox directory:

`/finngen/library-red/finngen_R[RELEASE]/hla_1.0/`

### Data files

* `R[RELEASE]_HLA.bgen`: HLA allele genotype data in bgen format
* `R[RELEASE]_HLA.bgen.bgi`: HLA allele genotype index in bgen format
* `R[RELEASE]_HLA.bgen.sample`: HLA allele genotype sample file
* `R[RELEASE]_HLA.bgen.snpstats`: HLA allele snpstats file
* `dosage/[GENE].dosage`: Dosage dta for a single gene
* `dosage/[GENE].dosage.map:` Dosage mapping file

Data is available for the following HLA genes: A, B, C, DPB1, DQA1, DQB1, DRB1, DRB3, DRB4, and DRB5.

Please refer to the readme file in the sandbox directory for full details of the available data.

### Further information

Read more about the [HLA imputation method](/finngen-data-specifics/green-library-data-aggregate-data/other-analyses-available/hla).


# Principal components analysis (PCA) data

This page has been last updated for R11.

### Sandbox directory

Principal components analysis (PCA) data is available in the following Sandbox directory:

`/finngen/library-red/finngen_R[RELEASE]/pca_1.0`

### Data files

The following types of files are available:

* PCA files
* Sample list files

Please refer to the readme file in the sandbox directory for full details of the available data.

#### PCA files

PCA files are in the `/data` subdirectory.

* `finngen_R[RELEASE].eigenval.txt`: List of eigenvalues of PCA. The nth line contains the eigenvalue for the nth principal component.
* `finngen_R[RELEASE].eigenvec.txt`: Principal components of all samples used in the analysis.
* `finngen_R[RELEASE]_eigenvec.var`: Loading of each variant.

Columns in the `finngen_R[RELEASE].eigenvec.txt` file:

<table data-header-hidden><thead><tr><th width="314"></th><th></th></tr></thead><tbody><tr><td><strong>Column</strong></td><td><strong>Description</strong></td></tr><tr><td>FID</td><td>Family ID (same as IID for FG)</td></tr><tr><td>IID</td><td>Sample ID</td></tr><tr><td>PCn</td><td>Value of the nth principal component</td></tr></tbody></table>

Columns in the `finngen_R[RELEASE]_eigenvec.var`file:

<table data-header-hidden><thead><tr><th width="316"></th><th></th></tr></thead><tbody><tr><td><strong>Column</strong></td><td><strong>Description</strong></td></tr><tr><td>#CHROM</td><td>Chromosome number</td></tr><tr><td>ID</td><td>Variant name</td></tr><tr><td>MAJ</td><td>Major allele</td></tr><tr><td>NONMAJ</td><td>Non-major allele</td></tr><tr><td>PCn</td><td>Loading of the nth principal component</td></tr></tbody></table>

#### Sample list files

Sample list files are in the `/data` subdirectory.

These files may have a single column of sample IDs or they may be in the Fam format. A file in the Fam format contains two tab-separated columns that both have the same sample IDs.

* `finngen_R[RELEASE]_unrelated.txt`: Fam file of unrelated samples used for final PCA.
* `finngen_R[RELEASE]_related.txt`: Fam file of samples related to the previous group projected onto their PC space.
* `finngen_R[RELEASE]_rejected.txt`: Fam file of rejected samples.
* `finngen_R[RELEASE]_duplicates.txt`: List of duplicate samples.
* `finngen_R[RELEASE]_total_ethnic_outliers.txt`: List of samples not of Finnish ancestry.
* `finngen_R[RELEASE]_final_samples.txt`: Fam file of all samples included in analysis.

#### Further information

See also: FAQ [Where can I find a list of inrelated individuals in FinnGen?](/faq/about-finngen-data/where-can-i-find-a-list-of-unrelated-individuals-in-finngen)


# Kinship data

This page has been last updated for R11.

### Sandbox directory

Kinship data is available in the following Sandbox directory:

`/finngen/library-red/finngen_R[RELEASE]/kinship_1.0`

### Data files

The following types of files are available:

* Plink files
* Kinship files

Please refer to the readme file in the sandbox directory for full details of the available data.

#### Plink files

Plink files are in the `/data` subdirectory.

These files are the output of [plink](https://www.cog-genomics.org/plink/2.0/formats). The dataset is built using pruned variants (see [prune section](/finngen-data-specifics/red-library-data-individual-level-data/genotype-data/types-of-genotype-files-available/prune-data)).

* `finngen_R[RELEASE]_kinship.bed`: Plink bed file with only pruned variants used for kinship
* `finngen_R[RELEASE]_kinship.fam`: Plink fam file with only pruned variants used for kinship
* `finngen_R[RELEASE]_kinship.bim`: Plink bim file with only pruned variants used for kinship
* `finngen_R[RELEASE]_kinship.afreq`: Plink freq file with only pruned variants used for kinship
* `finngen_R[RELEASE]_pedigree.fam`: Fam file with updated family IDs and sex

#### **Kinship files**

Kinship files are in the `/data` subdirectory.

These files are the output of [KING ](https://www.kingrelatedness.com)based on different flags:

* `finngen_R[RELEASE].kin0`: List of related couples (–-related)
* `finngen_R[RELEASE].con`: List of duplicate couples (--duplicate)

#### Further information

See also: FAQ [Does FinnGen have family and relatedness information available?](/faq/about-finngen-data/does-sandbox-have-family-and-relatedness-information-available)


# Analysis covariates

This page has been last updated for R13.

### Sandbox directory

Analysis covariates are available in the following Sandbox directory:

`/finngen/library-red/finngen_R[RELEASE]/analysis_covariates`

### Data files

The analysis covariate file is a tab-separated, gzip-compressed text file that contains covariate and endpoint data for each sample. The file contains three sets of columns:

* column 1: Sample ID
* columns 2 to N: covariates including principal components, \~200 columns for R13
* columns N+1 to N+1+number of endpoints: individual's phenotype status for each FinnGen endpoint

The covariate file does not contain FinnGen genotypes for individuals with non-Finnish ancestry. For more complete phenotype data see [the phenotype files](/finngen-data-specifics/red-library-data-individual-level-data/what-phenotype-files-are-available-in-sandbox-1).

Often users will subset this file in R to run their own analyses and/or add additional analysis columns.

#### Some column descriptions:

| **Column name**                        | **Description**                                                                                                      |
| -------------------------------------- | -------------------------------------------------------------------------------------------------------------------- |
| FINNGENID                              | Sample ID                                                                                                            |
| AGE\_AT\_DEATH\_OR\_END\_OF\_FOLLOWUP  | Age of sample at death or end of followup                                                                            |
| batch                                  | batch                                                                                                                |
| n\_var                                 | Number of genotyped variants                                                                                         |
| chip                                   | Chip used for genotyping                                                                                             |
| IS\_AFFY                               | Whether the sample was genotyped using Affymetrix chip                                                               |
| IS\_FINNGEN1\_CHIP                     | Whether the sample was genotyped using Finngen v1 chip                                                               |
| IS\_FINNGEN2\_CHIP                     | Whether the sample was genotyped using Finngen v2 chip                                                               |
| IS\_AFFY\_\*                           | Whether the chip genotypes were called using the specified version of the calling algorithm                          |
| AGE\_AT\_DEATH\_OR\_END\_OF\_FOLLOWUP2 | AGE\_AT\_DEATH\_OR\_FOLLOWUP\*AGE\_AT\_DEATH\_OR\_FOLLOWUP                                                           |
| BATCH\*                                | Whether the sample was part of that genotyping batch. Can be used to control for batch-specific effects in analysis. |
| PC\*                                   | Individual's PCA value for that component                                                                            |
| \*\_IRN                                | Inverse rank-normalized quantitative endpoints                                                                       |

For other columns, refer to the [minimum extended phenotype](/finngen-data-specifics/red-library-data-individual-level-data/what-phenotype-files-are-available-in-sandbox-1/minumum-extended-phenotype-data) and the [endpoint data](/finngen-data-specifics/red-library-data-individual-level-data/what-phenotype-files-are-available-in-sandbox-1/endpoint-and-endpoint-longitudinal-data) pages.

### Further information

The covariate file is used for GWAS and other analyses. The following covariates are used in FinnGen's core GWAS analyses:

* Age
* Sex
* First 10 principal components
* Genotyping batch (Finngen 1 or 2 chip and legacy genotyping batch)

**Note**: This file is usually released a little later than the phenotype files as it needs the PCA results to be created.


# Polygenic risk scores (PRS)

This page has been last updated for R11.

### Sandbox directory

Polygenic risk scores (PRS) are available in the following Sandbox directory:

`/finngen/library-red/finngen_R[RELEASE]/prs_1.0`

### Data files

The PRS data files are available for specific studies in the `/data` subdirectory.

The following types of files are available:

* Score files
* Weight files
* Correlation files

Please refer to the readme file in the sandbox directory for full details of the available data.

#### Score files

* `finngen_R[RELEASE]_[STUDY].sscore`: Individual scores for the specific study
* `finngen_R[RELEASE]_[STUDY].no_regions.sscore`: Individual scores with regions removed

Score files are produced using the [plink](https://www.cog-genomics.org/plink/2.0/formats) `-score` option and contain the following tab-separated columns:

| **Column**                 | **Description**             |
| -------------------------- | --------------------------- |
| #FID                       | Family ID                   |
| IID                        | Sample ID                   |
| NMISS\_ALLELE\_C           | Non-missing allele count    |
| NAMED\_ALLELE\_DOSAGE\_SUM | Sum of named allele dosages |
| SCORE1\_AVG                | Score                       |

#### Weight files

* `finngen_R[RELEASE]_[STUDY].weights.txt:` SNP weights produced by PRS-CS

Weight files are produced by PRScs. They contain the following tab-separated columns without column headers:

|            |                 |
| ---------- | --------------- |
| **Column** | **Description** |
| 1          | CHROM           |
| 2          | SNP             |
| 3          | POS             |
| 4          | REF             |
| 5          | ALT             |
| 6          | WEIGHT          |

#### Correlation files

* `finngen_R[RELEASE]_prs_pheno_corr.tsv:` GLM ross correlation between all PRS studies and all other phenotypes, sorted by p-value and filtered for p < 0.0001

Correlation files contain the following tab-separated columns:

| **Column** | **Description**                      |
| ---------- | ------------------------------------ |
| PHENO      | Phenotype                            |
| beta       | Type II error prob. (beta statistic) |
| pval       | p-value                              |
| p\_R2      | p R-squared value                    |
| pval\_F    | P-value of F-statistics              |
| study      | Study name                           |

### Further information

See also the [Using polygenic risk scores](/background-reading/using-prs-data) and [how to run PRS](/working-in-the-sandbox/running-analyses-in-sandbox/how-to-run-prs) sections.


# Genetic Ancestry

This page has been last updated for R11.<br>

### Sandbox directory

`/finngen/library-red/finngen_R12/genetic_ancestry_1.0`

### Description

In the [PCA pipeline](/finngen-data-specifics/red-library-data-individual-level-data/genotype-data/types-of-genotype-files-available/pca-data) we identify samples whose genetic background does not match the Finnish one. In this pipeline isntead, we try to provide further PC data that allows to provide more information regarding the ancestry of such samples.\
We perform PCA on 1k/HGDP data and project FinnGen outliers onto the same space in order to provide information about their ancestral background.\
Due to issues with PCs when merging different batches (shift away from populations due to imputed data), only the largest batches with enough common genotyped variants have been considered and merged togethers, with 15778 (93%) of outliers being included in the analysis and 3108 variants used for the PCA.\
PCA is computed on HGDP/1kg samples with the following plink args:

`--pca 3 approx biallelic-var-wts`\
\
N.B. The main goal of this pipeline is *not* to provide an exact labelling of each sample, but rather to provide information about their ancestral background through the PCs. The labels we provide are meant to be seen as a rough estimation of such information and we encourage the user not to rely on these values out of the box, but to take them as a starting point for further analysis.<br>

### Data files

\| File | Description |

\|---|---|

|\[PREFIX\_BATCHES]\_proj.eigenvec | HGDP PCA eigenvectors |

|\[PREFIX\_BATCHES]\_proj.eigenvec.var | HGDP PCA eigenvector loadings |

|\[PREFIX\_BATCHES]\_proj.eigenval | HGDP PCA eigenvalues|

|\[PREFIX\_BATCHES]\_proj\_proj.sscore | FG outliers projection onto HGDP space |

|\[PREFIX\_BATCHES]\_proj\_ref.sscore | HGDP projection back onto its EV space, so to harmonize with FG data |\
\
**Probabilities**

\| File | Description |

\|---|---|

|\[PREFIX\_BATCHES]\_proj\_probs.txt |Raw table with probabilities assigned to each FG outliers for each population label|

|\[PREFIX\_BATCHES]\_proj\_samples\_most\_likely\_region.txt | Most likely population based on probs file (argmax) |

|\[PREFIX\_BATCHES]*proj\_samples\_most\_likely\_region*\[PROB\_CUTOFF].txt | Most likely population based on probs file (argmax) above certain cutoff threshold|

|\[PREFIX\_BATCHES]\_proj\_finless\_samples\_most\_likely\_region.txt | Most likely population based on probs file (argmax) removing FIN probs|

|\[PREFIX\_BATCHES]*proj\_finles\_samples\_most\_likely\_region*\[PROB\_CUTOFF].txt | Most likely population based on probs file (argmax) above certain cutoff threshold removing FIN probs|

### Documentation

\
\| File | Description |

\|---|---|

|\[PREFIX\_BATCHES]\_proj\_scatter\_all.png/pdf | Pairwise PC plot of FG vs 1k data|

|\[PREFIX\_BATCHES]\_proj\_scatter\_tags.png/pdf | Pairwise PC plot of FG vs 1k data with different 1k populations labelled separately|

|\[PREFIX\_BATCHES]\_proj\_tags\_pc\_density.png/pdf | Density plots for each PC of FG/1k data grouped by pop |\ <br>

### Notes

These are typical outputs of PCA when using a mixed set of samples across batches, thus mixing semi-randomly chip and imputed data.\
![](https://3072695768-files.gitbook.io/~/files/v0/b/gitbook-x-prod.appspot.com/o/spaces%2F-MhYL0UTLjqsuIdK0SSO%2Fuploads%2F0ObNY8pIuxwbonumCwXw%2Fimage.png?alt=media\&token=24c49856-9ba2-492a-a637-d030bf677419)\
In the above figure, FG data is projected onto the 1k space, but the FG data components seem to be shrunk/shifted.\
![](https://3072695768-files.gitbook.io/~/files/v0/b/gitbook-x-prod.appspot.com/o/spaces%2F-MhYL0UTLjqsuIdK0SSO%2Fuploads%2FJQDtQwenrJ0WqEolLN98%2Fimage.png?alt=media\&token=6b4f8b15-0e18-4472-b2a3-4cbe614edd38)\
The same happens when merging the two datasets into one


# Genetic relationships (GRM)

This page has been last updated for R13.

### Sandbox directory

Genetic relationships (GRM) are available in the following Sandbox directory:

`/finngen/library-red/finngen_R[RELEASE]/grm_1.0`

### Data files

We use a high-quality LD-pruned subset of the imputed genotype data for genetic relationship matrix (GRM) calculation. The data has been generated using [plink](https://www.cog-genomics.org/plink/2.0/formats) with hard-called genotypes. Population outliers and genetic duplicates are excluded from the imputed genotype data files and this explains the difference in samples between imputed data files and GRM files.

* `R[RELEASE]_GRM_VO_LD_0.2.bed`: GRM file in PLINK binary biallelic genotype table format
* `R[RELEASE]_GRM_VO_LD_0.2.bim`: Extended variant information file accompanying the .bed file
* `R[RELEASE]_GRM_VO_LD_0.2.fam`: Sample information file accompanying the .bed file
* `R[RELEASE]_GRM_VO_LD_0.2.log`: Log from plink
* `R[RELEASE]_variants_info_allbatches_0.90.txt`: Sisu v4.2 panel variants with INFO score >= 0.90 in every batch in format "chr\_pos\_ref\_alt"

Please refer to the readme file in the sandbox directory for full details of the available data.


# Mosaic chromosomal alterations (mCA)

This page has been last updated for R11.

### Sandbox directory

Mosaic chromosomal alterations (mCAs) are available in the following Sandbox directory:

`/finngen/library-red/finngen_R[RELEASE]/mca_1.0/`

#### Data files

Two types of files are available for samples included in mCA calling:

* Basic information file
* Detailed information file

The mCA calling was done with MoChA (<https://github.com/freeseek/mocha>). For QC, we removed samples with call\_rate lower than 0.97 and baf\_auto greater than 0.03 and CNV calls likely to be germline.

**Basic information file**

Basic information of Affymetrix samples included in mCA calling, computed gender, genotype calling rate, and phased BAF, is available in the following file:

`data/finngen_R11_stats.tsv`

The number of samples in Data Release 11 (R11) was 395,716. Legacy samples are excluded since raw intensity data is not available for them.

**Detailed information file**

Detailed information of Affymetrix samples included in mCA calling, computed gender, chromosome, beginning/end base pair position, whether or not the call extends to p-arm/q-arm, BAF deviation, LRR, number of (heterozygous sites) used for the call, mCA type, and cell fraction, is available in the following file:

`data/finngen_R11_mca.tsv`

The number of samples in Data Release 11 (R11) was 116,401.

### Further information

For more details regarding mCA calling and QC, see:

(1) Liu, A., Genovese, G., Zhao, Y., Pirinen, M., Zekavat, M.M., Kentistou, K., Yang, Z., Yu, K., Vlasschaert, C., Liu, X. and Brown, D.W., 2023. Population analyses of mosaic X chromosome loss identify genetic drivers and widespread signatures of cellular selection. medRxiv, pp.2023-01.

(2) Zekavat, S.M., Lin, S.H., Bick, A.G., Liu, A., Paruchuri, K., Wang, C., Uddin, M.M., Ye, Y., Yu, Z., Liu, X. and Kamatani, Y., 2021. Hematopoietic mosaic chromosomal alterations increase the risk for diverse types of infection. Nature medicine, 27(6), pp.1012-1024.

(3) Koskela, J.T., Häppölä, P., Liu, A., FinnGen, Partanen, J., Genovese, G., Artomov, M., Myllymäki, M.N., Kanai, M., Zhou, W. and Karjalainen, J.M., 2021. Genetic variant in SPDL1 reveals novel mechanism linking pulmonary fibrosis risk and cancer protection. medRxiv, pp.2021-05.


# Prune data (R9)

This page has been last updated for R9. Prune data is not available for more recent releases.

### Sandbox directory

Prune data is available in the following sandbox directory:

`/finngen/library-red/finngen_R9/prune_1.0/`

### Data files

The following data file has been created using [plink](https://www.cog-genomics.org/plink/2.0/) LD's pruning method. It is a simple list of SNPs:

`data/finngen_R9.prune.in`

Please refer to the readme file in the sandbox directory for full details of the available data.


# Imputed STR genotypes (R8)

This page has been last updated for R8. Imputed STR genotypes are only available for this data release.

### Sandbox directory

Imputed short tandem repeat (STR) genotypes are available in the following sandbox directory:

`/finngen/library-red/finngen_R8/imputed_str_1.0/`

### Data files

One VCF file is available for each chromosome:

`data/finngen_R8_STRs_chr[CHROM].vcf.gz`

The VCF files come with their `.tbi` files.

Please refer to the readme file in the sandbox directory for full details of the available data.


# Phenotype data

FinnGen phenotype data is available to Sandbox users.

### Sandbox directory

Phenotype data is available in the following sandbox directory:

`/finngen/library-red/finngen_R[RELEASE]`

For example, FinnGen Data Release 12 files are in the following directory:

* **Release 12:** `/finngen/library-red/finngen_R12/`

### Registers

FinnGen contains phenotype data from the following registers:

<table data-header-hidden data-full-width="true"><thead><tr><th width="151"></th><th width="139"></th><th width="194"></th><th></th></tr></thead><tbody><tr><td><strong>Abbreviation *1</strong></td><td><strong>Abbreviation *1</strong></td><td><strong>Register</strong></td><td><strong>Source</strong></td></tr><tr><td><strong>PURCH</strong></td><td><strong>LAAKE_ATC</strong></td><td>Kela drug purchase register (since 1995)</td><td>Social Insurance Institution of Finland (Kela)</td></tr><tr><td><strong>REIMB</strong></td><td><strong>KELAEK</strong></td><td>Kela drug reimbursement register (since 1964)</td><td>Social Insurance Institution of Finland (Kela)</td></tr><tr><td><strong>INPAT</strong></td><td><strong>HILMO</strong></td><td>Inpatient Hilmo register (Health-Hilmo) (since 1969)</td><td>Finnish Institute for Health and Welfare (THL) <a href="https://thl.fi/en/web/thlfi-en/statistics-and-data/data-and-services/register-descriptions/care-register-for-health-care">Care Register for Health Care</a></td></tr><tr><td><strong>OPER_IN</strong></td><td><strong>OPER</strong></td><td>Inpatient Hilmo register (Health-Hilmo) operations (since 1969)</td><td>Finnish Institute for Health and Welfare (THL) <a href="https://thl.fi/en/web/thlfi-en/statistics-and-data/data-and-services/register-descriptions/care-register-for-health-care">Care Register for Health Care</a></td></tr><tr><td><strong>OUTPAT</strong></td><td><strong>ERIK_AVO</strong></td><td>Specialist outpatient Hilmo register (Health-Hilmo) (since 1998)</td><td>Finnish Institute for Health and Welfare (THL) <a href="https://thl.fi/en/web/thlfi-en/statistics-and-data/data-and-services/register-descriptions/care-register-for-health-care">Care Register for Health Care</a></td></tr><tr><td><strong>OPER_OUT</strong></td><td><strong>ERIK_OPER</strong></td><td>Specialist outpatient Hilmo register (Health-Hilmo) operations (since 1998)</td><td>Finnish Institute for Health and Welfare (THL) <a href="https://thl.fi/en/web/thlfi-en/statistics-and-data/data-and-services/register-descriptions/care-register-for-health-care">Care Register for Health Care</a></td></tr><tr><td><strong>PRIM_OUT</strong></td><td><strong>AVO</strong></td><td>Primary health care outpatient visits register (Avohilmo) (since 2011)</td><td>Finnish Institute for Health and Welfare (THL) <a href="https://thl.fi/en/web/thlfi-en/statistics-and-data/data-and-services/register-descriptions/register-of-primary-health-care-visits">Register of Primary Heath Care visits</a></td></tr><tr><td><strong>CANC</strong></td><td><strong>CANCER</strong></td><td>Cancer register (since 1953)</td><td>Finnish Cancer Registry</td></tr><tr><td><strong>DEATH</strong></td><td><strong>DEATH</strong></td><td>Cause of death register (since 1969)</td><td>Statistics Finland</td></tr></tbody></table>

{% hint style="info" %}
\*1 Different abbreviations may be used in different contexts. For example, the detailed longitudinal data file uses the abbreviations in the first column and endpoint longitudinal data uses the abbreviations in the second column.
{% endhint %}

### Further information

The phenotype data files are described in the following sections:

* [Register data](/finngen-data-specifics/red-library-data-individual-level-data/what-phenotype-files-are-available-in-sandbox-1/registers-in-the-detailed-longitudinal-data)
* [Detailed longitudinal data](/finngen-data-specifics/red-library-data-individual-level-data/what-phenotype-files-are-available-in-sandbox-1/detailed-longitudinal-data)
* [Endpoint and endpoint longitudinal data](/finngen-data-specifics/red-library-data-individual-level-data/what-phenotype-files-are-available-in-sandbox-1/endpoint-and-endpoint-longitudinal-data)
* [Kanta Lab data](/finngen-data-specifics/red-library-data-individual-level-data/what-phenotype-files-are-available-in-sandbox-1/kanta-lab-values)
* [Minimum extended phenotype data](/finngen-data-specifics/red-library-data-individual-level-data/what-phenotype-files-are-available-in-sandbox-1/minumum-extended-phenotype-data)
* [Minimum longitudinal data](/finngen-data-specifics/red-library-data-individual-level-data/what-phenotype-files-are-available-in-sandbox-1/minimum-longitudinal-data)
* [Other registry data files in Sandbox](/finngen-data-specifics/red-library-data-individual-level-data/what-phenotype-files-are-available-in-sandbox-1/other-registers)

{% hint style="info" %}
A list of variables received from the registers through THL and other information about the registers is available in the FinnGen members area [here](https://www.finngen.fi/en/members/document/279). Some additional information about the variables is available [here](https://www.finngen.fi/system/files/2021-10/FinnGen_Phenotype_variables_R8_2021-09-29.xlsx).

The FinnGen register data was presented in the [FinnGen data users meeting on 12 January 2021](https://www.finngen.fi/en/members/recordings/finngen-data-users-meeting-12-jan-2021).
{% endhint %}


# Register data

FinnGen contains data from a large number of Finnish registers. This data is only available in the Sandbox.

{% hint style="info" %}
Depending on the register, the data is accessible from:

* [Detailed longitudinal data file](/finngen-data-specifics/red-library-data-individual-level-data/what-phenotype-files-are-available-in-sandbox-1/detailed-longitudinal-data)
* [Service sector data file](/finngen-data-specifics/red-library-data-individual-level-data/what-phenotype-files-are-available-in-sandbox-1/service-sector-data)
* [Atlas](/working-in-the-sandbox/which-tools-are-available/atlas) and [OMOP CDM](/working-in-the-sandbox/which-tools-are-available/atlas/detailed-guide/atlas-data-model)
* Other data file (e.g. [Minimum extended phenotype data file](/finngen-data-specifics/red-library-data-individual-level-data/what-phenotype-files-are-available-in-sandbox-1/minumum-extended-phenotype-data))
  {% endhint %}

### Summary

The following table summarises the FinnGen registers and clinical data sets available in FinGen and where the data is available:

<table data-header-hidden data-full-width="true"><thead><tr><th width="197"></th><th></th><th></th><th></th><th></th><th></th></tr></thead><tbody><tr><td><strong>Phenotype data set</strong></td><td><p><strong>Start</strong></p><p><strong>year or time period</strong></p></td><td><strong>Standardized codes used</strong></td><td><p><strong>In the</strong> <a href="/finngen-data-specifics/red-library-data-individual-level-data/what-phenotype-files-are-available-in-sandbox-1/detailed-longitudinal-data"><strong>Detailed longitudinal</strong></a></p><p><strong>and</strong></p><p><a href="/finngen-data-specifics/red-library-data-individual-level-data/what-phenotype-files-are-available-in-sandbox-1/service-sector-data"><strong>Service sector data file</strong></a> <strong>(abbreviation)</strong></p></td><td><p><a href="/working-in-the-sandbox/which-tools-are-available/atlas"><strong>Atlas</strong></a></p><p><strong>and</strong></p><p><a href="/working-in-the-sandbox/which-tools-are-available/atlas/detailed-guide/atlas-data-model"><strong>OMOP CDM</strong></a> <strong>availability</strong></p></td><td><strong>Other data file</strong></td></tr><tr><td><a href="/finngen-data-specifics/red-library-data-individual-level-data/what-phenotype-files-are-available-in-sandbox-1/other-registers/finnish-cancer-registry-detailed-cancer-data">Finnish Cancer Registry</a></td><td>1953</td><td>ICD-O-3</td><td>Yes (CANC)</td><td>Yes</td><td>Yes (Click first column link to see data location)</td></tr><tr><td><a href="https://www.kela.fi/kelas-research-and-statistics">Drug Reimbursement (KELA)</a></td><td>1964</td><td>ICD for indication, Finnish specific reimbursement codes</td><td>Yes (REIMB)</td><td>Yes</td><td></td></tr><tr><td><a href="https://www.kela.fi/kelas-research-and-statistics">Drug Purchase (KELA)</a></td><td>1995</td><td>ICD for indication, Finnish specific reimbursement code</td><td>Yes (PURCH)</td><td>Yes</td><td></td></tr><tr><td><a href="https://www.stat.fi/til/ksyyt/index_en.html">Causes of death (STAT)</a></td><td>1969</td><td>ICD-10,9,8</td><td>Yes (DEATH)</td><td>Yes</td><td></td></tr><tr><td><a href="https://thl.fi/en/statistics-and-data/data-and-services/register-descriptions/care-register-for-health-care">Care Register for Health Care, inpatient visits (THL Hilmo)</a></td><td>1969</td><td>ICD-10,9,8 and ATC</td><td>Yes (INPAT)</td><td>Yes</td><td></td></tr><tr><td><a href="https://thl.fi/en/statistics-and-data/data-and-services/register-descriptions/care-register-for-health-care">Care Register for Health care, inpatient operations (THL HIlmo)</a></td><td>1986</td><td>Finnish specific NOMESCO and Finnish Hospital League operation codes</td><td>Yes (OPER_IN)</td><td>Yes</td><td></td></tr><tr><td><a href="https://thl.fi/en/statistics-and-data/data-and-services/register-descriptions/care-register-for-health-care">Primary Health Care specialist outpatient visits incl. operations (THL Hilmo)</a></td><td>1998</td><td>NOMESCO and Finnish Hospital League operation codes</td><td>Yes (OUTPAT/OPER_OUT)</td><td>Yes</td><td></td></tr><tr><td><a href="https://thl.fi/en/statistics-and-data/information-on-statistics/description-of-statistics/primary-health-care">Primary Health Care outpatient visits (Avohilmo)</a></td><td>2011</td><td>ICD10, nurse procedures( SPAT codes) , nurse provided cause of visit (ICPC)</td><td>Yes (PRIM_OUT)</td><td>Yes</td><td></td></tr><tr><td><a href="https://dvv.fi/en/population-information-system">Population Register (DVV)</a></td><td>1964</td><td></td><td></td><td>Birth data as of DF12</td><td><a href="/finngen-data-specifics/red-library-data-individual-level-data/what-phenotype-files-are-available-in-sandbox-1/minumum-extended-phenotype-data">Minimum extended phenotype data file</a></td></tr><tr><td><a href="/finngen-data-specifics/red-library-data-individual-level-data/what-phenotype-files-are-available-in-sandbox-1/other-registers/finnish-registry-for-kidney-diseases">Finnish Registry for Kidney Diseases</a></td><td>1964</td><td>Click first column link to see data description</td><td></td><td>Yes</td><td>Click first column link to see data file location</td></tr><tr><td><a href="/finngen-data-specifics/red-library-data-individual-level-data/what-phenotype-files-are-available-in-sandbox-1/other-registers/the-finnish-register-of-visual-impairment">Finnish Register of Visual Impairment (THL)</a></td><td>1983</td><td>Click first column link to see data description</td><td></td><td>Yes</td><td>Click first column link to see data file location</td></tr><tr><td><a href="/finngen-data-specifics/red-library-data-individual-level-data/what-phenotype-files-are-available-in-sandbox-1/other-registers/reproductive-history-data">Medical Birth Register (THL)</a></td><td>1987</td><td>Click first column link to see data description</td><td></td><td>Yes</td><td>Click first column link to see data file location</td></tr><tr><td><a href="/finngen-data-specifics/red-library-data-individual-level-data/what-phenotype-files-are-available-in-sandbox-1/other-registers/the-register-of-congenital-malformations">Register of Congenital Malformations (THL)</a></td><td>1980</td><td>Click first column link to see data description</td><td></td><td></td><td>Click first column link to see data file location</td></tr><tr><td><a href="/finngen-data-specifics/red-library-data-individual-level-data/what-phenotype-files-are-available-in-sandbox-1/other-registers/socioeconomic-data">Sosioeconomic data (STAT)</a> (limited access to Finnish researchers)</td><td>1970</td><td>Click first column link to see data description</td><td></td><td></td><td>Click first column link to see data file location</td></tr><tr><td><a href="/finngen-data-specifics/red-library-data-individual-level-data/what-phenotype-files-are-available-in-sandbox-1/other-registers/infectious-disease-registry-covid-19">Finnish National Infectious Disease Register (THL)</a></td><td>1989</td><td>Click first column link to see data description</td><td></td><td></td><td>Click first column link to see data file location</td></tr><tr><td><a href="/finngen-data-specifics/red-library-data-individual-level-data/what-phenotype-files-are-available-in-sandbox-1/other-registers/finnish-cancer-registry-cervical-cancer-screening">Finnish Cancer Registry: Cervical cancer screening (THL)</a></td><td>1991</td><td>Click first column link to see data description</td><td></td><td></td><td>Click first column link to see data file location)</td></tr><tr><td><a href="/finngen-data-specifics/red-library-data-individual-level-data/what-phenotype-files-are-available-in-sandbox-1/other-registers/finnish-cancer-registry-breast-cancer-screening">Finnish Cancer Registry: Breast cancer screening (THL)</a></td><td>1992</td><td>Click first column link to see data description</td><td></td><td></td><td>Click first column link to see data file location</td></tr><tr><td><a href="/finngen-data-specifics/red-library-data-individual-level-data/what-phenotype-files-are-available-in-sandbox-1/other-registers/finnish-national-vaccination-registry">Finnish National Vaccination Register (THL)</a></td><td>2011</td><td>Click first column link to see data description</td><td></td><td></td><td>Click first column link to see data file location</td></tr><tr><td><a href="/finngen-data-specifics/expansion-area-3-ea3-projects/ea3-study-fatty-liver-disease-project-and-data-in-sandbox">EA3: Fatty liver disease</a></td><td>31.5.2012-31.5.2022</td><td>Click first column link to see data description</td><td></td><td></td><td>Click first column link to see data file location</td></tr><tr><td><a href="/finngen-data-specifics/expansion-area-3-ea3-projects/ea3-study-age-related-macular-degeneration-project-and-data-in-sandbox">EA3: Age-related macular degeneration</a></td><td></td><td>Click first column link to see data description</td><td></td><td></td><td>Click first column link to see data file location</td></tr><tr><td><a href="/finngen-data-specifics/expansion-area-3-ea3-projects/ea3-study-womens-health-studies/ea3-study-womens-health-female-infertility-and-pcos-study-variables">EA3: Women's health PCOS</a></td><td>1.1.1990-1.2.2023</td><td>Click first column link to see data description</td><td></td><td></td><td>Click first column link to see data file location</td></tr><tr><td><a href="/finngen-data-specifics/expansion-area-3-ea3-projects/ea3-study-womens-health-studies/ea3-study-womens-health-endometriosis-study-variables">EA3: Women's health Endometriosis</a></td><td>until 23.3.2023</td><td>Click first column link to see data description</td><td></td><td></td><td>Click first column link to see data file location</td></tr><tr><td><a href="/finngen-data-specifics/expansion-area-3-ea3-projects/ea3-study-womens-health-studies/ea3-womens-health-human-papilloma-virus-related-gynecological-lesions-study-and-data">EA3: Women's health</a></td><td>until 22.2.2023</td><td>Click first column link to see data description</td><td></td><td></td><td>Click first column link to see data file location</td></tr><tr><td><a href="/finngen-data-specifics/expansion-area-3-ea3-projects/ea3-study-pulmonology-study-variables">EA3: Pulmonology</a></td><td>1.1.2000-23.11.2022</td><td>Click first column link to see data description</td><td></td><td></td><td>Click first column link to see data file location</td></tr><tr><td><a href="/finngen-data-specifics/expansion-area-3-ea3-projects/ea3-study-diabetes-rkd-study-variables">EA3: Diabetes and rate kidney diseases</a></td><td>until 31.10.2022</td><td>Click first column link to see data description</td><td></td><td></td><td>Click first column link to see data file location</td></tr><tr><td><a href="/finngen-data-specifics/expansion-area-3-ea3-projects/ea3-study-heart-failure-variables">EA3: Heart Failure</a></td><td></td><td>Click first column link to see data description</td><td></td><td></td><td>Click first column link to see data file location</td></tr><tr><td><a href="/finngen-data-specifics/expansion-area-3-ea3-projects/ea3-study-immune-mediated-diseases">EA3: Immune-mediated diseases (Rheumatic and IBD)</a></td><td>14.3.2013-14.3.2023</td><td>Click first column link to see data description</td><td></td><td></td><td>Click first column link to see data file location</td></tr></tbody></table>

Table abbreviations:

* KELA: Social Insurance Institution of Finland
* STAT: Statistics Finland
* THL: Finnish Institute for Health and Welfare
* THL Hospital Inpatient and Outpatient (Hilmo): THL [Care Register for Health Care](https://thl.fi/en/statistics-and-data/data-and-services/register-descriptions/care-register-for-health-care)
* THL Primary Care and Health Centers (Avohilmo): THL [Register of Primary Health Care Visits](https://thl.fi/en/statistics-and-data/information-on-statistics/description-of-statistics/primary-health-care) register
* DVV: Digital and Population Data Services Agency
* EA3: Expansion area 3

{% hint style="info" %}
An example of how the Finnish register data has been used can be found in [this publication](https://journals.sagepub.com/doi/pdf/10.1177/14034948211004421).
{% endhint %}

### Hilmo

The Finnish Social and Healthcare Notification System ([Hilmo](https://thl.fi/fi/tilastot-ja-data/ohjeet-tietojen-toimittamiseen/hoitoilmoitusjarjestelma-hilmo)) is a nationwide social and healthcare data collection and reporting system maintained by the Finnish Institute for Health and Welfare (THL). FinnGen has data from

* Hilmo (Health-Hilmo): information on inpatient care and specialized outpatient care ([Care Register for Health Care](https://thl.fi/en/statistics-and-data/data-and-services/register-descriptions/care-register-for-health-care))
* Avohilmo: information on outpatient care and occupational health care ([Register of Primary Health Care visits](https://thl.fi/en/statistics-and-data/information-on-statistics/description-of-statistics/primary-health-care))

### Hospital data (inpatient and outpatient) - Hilmo (Health-Hilmo) register

The Hilmo ([Care Register for Health Care](https://thl.fi/en/statistics-and-data/data-and-services/register-descriptions/care-register-for-health-care)) register from THL has information on:

* Patients discharged from inpatient care (since 1969)
* Surgical operations (since 1986)
* Specialised outpatient care (since 1998)

#### **Accuracy and reliability**

Health-Hilmo data is reviewed for any errors and omissions as soon as it arrives at the Finnish Institute for Health and Welfare (THL). Since 2016, the data has been reviewed using an automatic process that checks, among other things, mandatory data and whether the codes contained in the data correspond to the codes defined for Health-Hilmo. If errors or omissions are found in the review, the data provider is informed and responsible for correcting, supplementing or resubmitting the material.

The compiled statistics are compared with the corresponding statistics of the previous year. Unclear cases will be checked with the data providers. If, despite revisions and corrections, the data is left with deficiencies or errors, they are described in the statistical report.

The quality of the data collected in Health-Hilmo has been assessed since its inception in 1969 in more than 30 scientific studies (a list can be found [here](https://thl.fi/fi/tilastot-ja-data/aineistot-ja-palvelut/tilastojen-laatu-ja-periaatteet/laatuselosteet/esh)). The majority of these studies have focused on cardiovascular disease, mental disorders and injuries. The general conclusion is that the data on treatment periods is comprehensive and that the main diagnoses and priority (main) procedures have been well reported. Some data omissions on side diagnoses and other procedures have been identified. Additionally, the quality and coverage of data have been observed to vary between hospital districts.

A quality report on specialized health care, in Finnish, can be found [here](https://thl.fi/fi/tilastot-ja-data/aineistot-ja-palvelut/tilastojen-laatu-ja-periaatteet/laatuselosteet/esh). The [Hilmo Opas](https://thl.fi/fi/tilastot-ja-data/ohjeet-tietojen-toimittamiseen/hoitoilmoitusjarjestelma-hilmo/hilmo-opas) contains some details of the quality assurance process.

### Primary care data - Avohilmo register

The Avohilmo ([Register of Primary Health Care visits](https://thl.fi/en/statistics-and-data/information-on-statistics/description-of-statistics/primary-health-care)) register from THL has information since 2011 on:

* Outpatient care visits, procedures, home care, and occupational health care

{% hint style="warning" %}
The data in Avohilmo is not as reliable as in Hilmo (Health-Hilmo). Finnish doctors are legally responsible for entering codes into Health-Hilmo. This is not the case in Avohilmo. Some codes are also provided by nurses (ICPC2) in Avohilmo.
{% endhint %}

#### **Accuracy and reliability** <a href="#docs-internal-guid-fbb48ace-7fff-a247-a7e3-d3c3bb0d3aed" id="docs-internal-guid-fbb48ace-7fff-a247-a7e3-d3c3bb0d3aed"></a>

Data quality is monitored by the Finnish Institute for Health and Welfare (THL) and the data producers using [Avohilmo's reports](https://sampo.thl.fi/pivot/prod/fi/avopika) which are updated daily. These reports monitor the coverage and quality of the data collection by service providers and type of service, as well as the coverage for reasons of visits including:

* [Visits on a weekly and monthly basis](https://sampo.thl.fi/pivot/prod/fi/avopika/pikarap01/summary_kaynnitkkvko)
* [Reasons for visits and their recording rates monthly](https://sampo.thl.fi/pivot/prod/fi/avopika/pikarap02/summary_kayntisyyt)
* [Procedures and their recording rates monthly](https://sampo.thl.fi/pivot/prod/fi/avopika/pikarap03/summary_toimenpiteet)
* [Acute respiratory infection (influenza and other viruses](https://sampo.thl.fi/pivot/prod/fi/avopika/pikarap04/summary_influtkkvko))

THL reaches out to the data providers to request corrections if any shortcomings in the quality are identified. The data correction is always done by the data producers. If necessary, the Avohilmo register incorporates updated and corrected data, mainly from the last year. During 2020, the coverage of Avohilmo data was reviewed on a weekly basis for each patient information system. The information system vendors and service providers were contacted to correct any missing information.

A quality report of Avohilmo can be found [here](https://thl.fi/fi/tilastot-ja-data/aineistot-ja-palvelut/tilastojen-laatu-ja-periaatteet/laatuselosteet/perusterveydenhuolto) (in Finnish).

### Causes of death register

The [Causes of death register](https://www.stat.fi/til/ksyyt/index_en.html) from Statistics Finland has information since 1969 on:

* the year and date of death
* the basic cause of death
* the immediate cause of death
* 1-4 contributing causes of death
* harmonized 54-class basic cause of death classification ([54 categories](https://www.stat.fi/en/luokitukset/kuolinsyyt/kuolinsyyt_61_19960101/)) (not used in FinnGen)

The classifications of causes of death are described in the [home page of the statistics in Classifications](https://www.stat.fi/en/luokitukset/) under the "Population and Education" section.

{% hint style="info" %}
The data is derived from death certificates and complemented by data on deaths from the Population Information System of the Population Register. The statistics on causes of death include all deaths in Finland or abroad of persons permanently resident in Finland at the time of their death.
{% endhint %}

#### **Accuracy and reliability** <a href="#docs-internal-guid-fbb48ace-7fff-a247-a7e3-d3c3bb0d3aed" id="docs-internal-guid-fbb48ace-7fff-a247-a7e3-d3c3bb0d3aed"></a>

The data is very reliable and the cause and time of death are accurately recorded. A quality report can be found [here](https://stat.fi/en/statistics/documentation/ksyyt).

**Consistency**

* Between 1969 and 1986, the international classification ICD-8 was used with [Finnish additions](https://taika.stat.fi/en/aineistokuvaus.html#!?dataid=ksyyt_197100_jua_kuolemansyyt_001.xml).
* Between 1987 and 1995, the data was classified using the national classification of diseases 1987, ICD9, where comparability to the international version is maintained.
* Since 1996, the statistics have been compiled based on the 10th revision of the International Classification of Diseases (ICD-10), with some Finnish additions (listed [here](https://taika.stat.fi/en/aineistokuvaus.html#!?dataid=ksyyt_197100_jua_kuolemansyyt_001.xml) in Finnish). This is the WHO version of ICD10 and does not include some of the subtypes and extensions of the ICD10 codes used in the full Finnish set of ICD codes.

### Cancer register

The [Finnish Cancer Registry](https://cancerregistry.fi/) has data since 1953.

{% hint style="info" %}
Healthcare organizations in Finland have a statutory obligation to provide information on every cancer case or strong suspicion of cancer to the Finnish Cancer Registry.
{% endhint %}

The Finnish Cancer Registry is also a statistical and epidemiological research institute that does active collaboration both nationally and internationally. It has three main focus areas: cancer statistics, research and screening.

* **Cancer statistics** are used to monitor the incidence of new cancer cases and the survival and mortality of cancer patients. The statistics of the[ Cancer Screening Registry](https://cancerregistry.fi/screening/) are used in the evaluation and quality control of cancer screening.
* **Cancer research** focuses on identifying the causes of cancer in the population, prevention and early detection of cancer, together with factors affecting the survival of cancer patients.
* **Cancer screening** is the systematic search for the precursors or early stages of cancer in the population. The goal is to reduce deaths due to cancer among those screened. [Cervical and breast cancer screening data](/finngen-data-specifics/red-library-data-individual-level-data/what-phenotype-files-are-available-in-sandbox-1/other-registers) is included in the FinnGen.

#### **Accuracy and reliability** <a href="#docs-internal-guid-fbb48ace-7fff-a247-a7e3-d3c3bb0d3aed" id="docs-internal-guid-fbb48ace-7fff-a247-a7e3-d3c3bb0d3aed"></a>

The data is very reliable. The Finnish Cancer Registry quality controls the data and uses it for its own research activities.

### Drug purchase register

The [Drug Purchase register](https://www.kela.fi/kelas-research-and-statistics) from KELA has information since 1995 on:

* persons who during a specific time period have purchased medicines that are reimbursed
* reimbursements for medicines purchased during a specific time period
* costs for medicines purchased during a specific time period
* prescription medicines purchased during a specific time period

{% hint style="info" %}
The data is based on purchases of dispensed medicines reimbursable under the Finnish National Health Insurance (NHI) Scheme by the date of purchase. The purchase of medicines is accompanied by an on-the-spot NHI reimbursement to the customer according to the prescription record.
{% endhint %}

All permanent residents of Finland are covered by the Finnish National Health Insurance (NHI) Scheme and are eligible to reimburse the cost of reimbursable medicines prescribed by a doctor or dentist. Only outpatient medication costs are covered by the National Health Insurance Scheme. Medication administered in public hospitals is not reimbursable. Annual statistics are completed by the end of March following the end of the reference year.

#### **Accuracy and reliability**

These statistics are compiled from an individual-level registry on medicine reimbursements. They are produced from the benefits system for pharmacy payment reporting (prescription file). Any errors detected are corrected immediately in accordance with the release guidelines issued by the Advisory Board of the Official Statistics of Finland. Errors discovered in the online service are corrected and the erroneous information is removed.

#### **Consistency**

The effect of legislative amendments on eligibility conditions and rates should be taken into account when making year-to-year comparisons. Data on reimbursements for prescription medicines have been collected since 1995. The reimbursement scheme for medicines was changed at the beginning of 2006 with the right to reimburse smaller purchases than before. Since the beginning of 2007, the data also includes medicine purchases reimbursed by the workplace funds.

Other things to keep in mind include:

* The buyer of reimbursed prescription medicines may not use all the medicines purchased
* The data only includes outpatient medication and not inpatient (hospital) medication
* The data does not include prescription medicines not approved for reimbursement by the Pharmaceuticals Pricing Board
* The data does not include most of the over-the-counter (OTC) medicines

More information about reimbursed medicines including changes in the annual limit on out-of-pocket prescription drug expenses and reimbursement rates is available [here](https://www.kela.fi/laakkeet).

### Drug reimbursement register

The [Drug Reimbursement register](https://www.kela.fi/kelas-research-and-statistics) from KELA has data since 1964.

{% hint style="info" %}
The medicine reimbursement system was created in Finland in 1964. The Health Insurance Scheme is administered by the Social Insurance Institution of Finland (Kela) and covers all residents of Finland. The latest version of the Health Insurance Act (Sairausvakuutuslaki) is 1224/2004.
{% endhint %}

The Health Insurance Scheme reimburses some of the costs for prescription medicines which are used for the treatment of an illness. An over-the-counter product may also be granted reimbursement status if the product is prescribed by a physician and considered, on medical grounds, to be an indispensable medicinal product. Basic topical ointments prescribed for the treatment of chronic skin ailments are also reimbursable, as are clinical nutritional preparations used in the treatment of a serious illness. Reimbursement is also paid to a limited group of patients for the dosage service fee charged by pharmacies.

The payment of reimbursement is possible only after the Pharmaceuticals Pricing Board has approved the reimbursement status of the medicine, basic topical ointment or clinical nutritional preparation and confirmed its reasonable wholesale price. The Pharmaceuticals Pricing Board operates under the auspices of the Ministry of Social Affairs and Health.


---

[Next Page](/llms-full.txt/1)